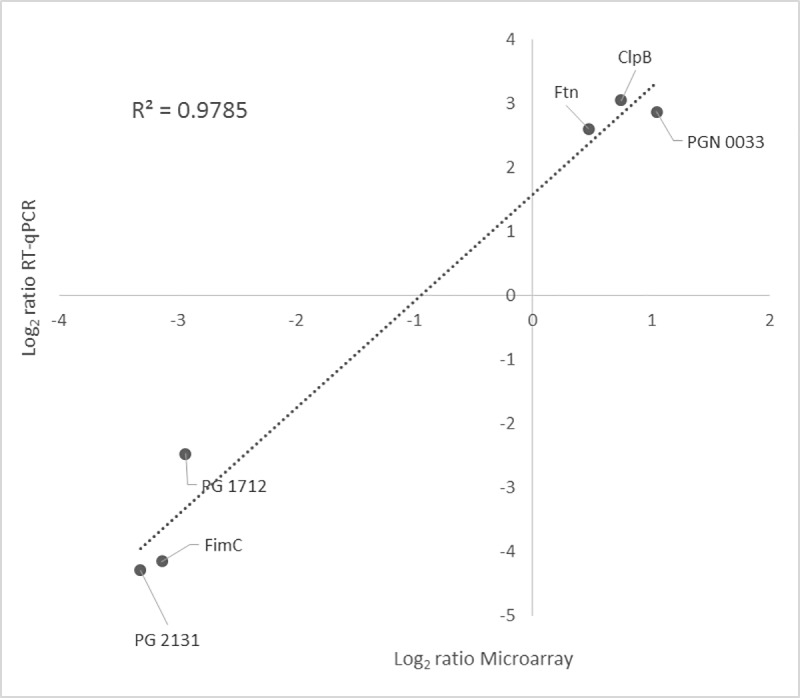
Fig 6. Correlation between Microarray and Reverse Transcription-quantitative Polymerase Chain Reaction (RT-qPCR) gene expression ratios when comparing Porphyromonas gingivalis ATCC 33277 growing within a multispecies-biofilm versus planktonic growth.

RT-qPCR log2 values were plotted against the microarray data log2 values (R2 = 0.9785).
