
Figure 2. Reduced Carbohydrate Consumption Rapidly Alters Gut Microbial Composition.
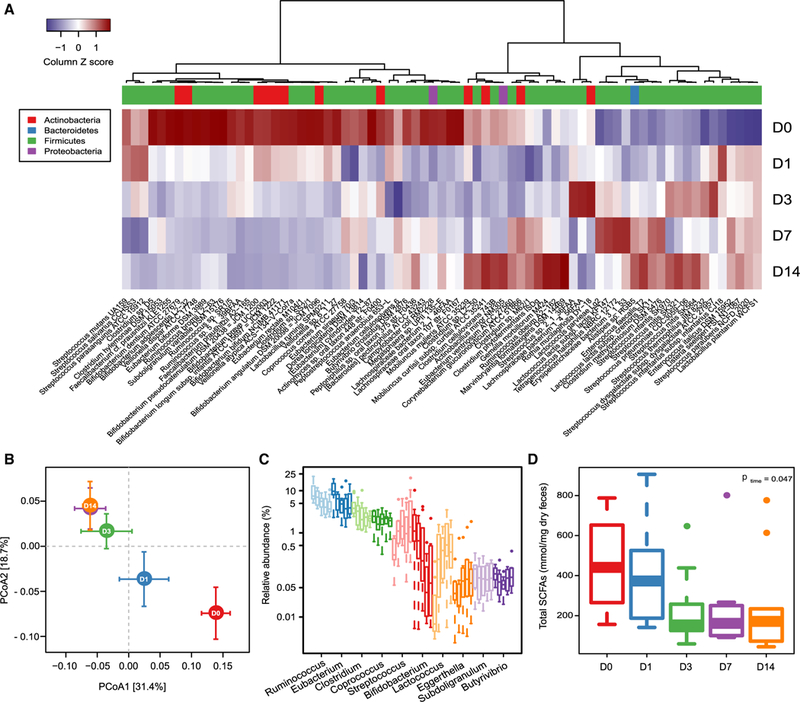
(A) Heatmap showing significant changes in the abundance of bacterial strains over the 14-day study period. D, day. FDR < 0.05; likelihood ratio test.
(B) PCoA plot based on the relative abundance of all bacterial strains that are significantly altered over the study period at the indicated time points (mean ± SEM; p D1 versus D0 = 0.049; Adonis test based on 5,000 permutations).
(C) Boxplots (with median) showing the relative abundance of the ten most abundant genera that were significantly altered by the diet over the study period (n = 10). FDR < 0.05; likelihood ratio test.
(D) Boxplots (with median) showing fecal concentrations of SCFAs at days 0,1,3,7, and 14(n = 10).p values across time were obtained by one-way ANOVA with repeated measurements.
See also Table S2.