
Figure 1.
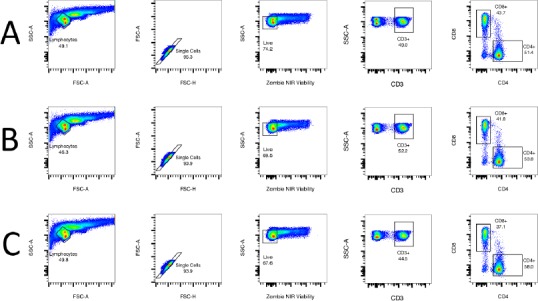
Example lineage gating strategy using pseudocolor dot plots. Shown are example hierarchies from the non-stimulated sample (A), the 24 h stimulated sample (B) and the 48 h stimulated sample from donor C (C). Figure generated using FlowJo.
Official websites use .gov
A
.gov website belongs to an official
government organization in the United States.
Secure .gov websites use HTTPS
A lock (
) or https:// means you've safely
connected to the .gov website. Share sensitive
information only on official, secure websites.
Example lineage gating strategy using pseudocolor dot plots. Shown are example hierarchies from the non-stimulated sample (A), the 24 h stimulated sample (B) and the 48 h stimulated sample from donor C (C). Figure generated using FlowJo.