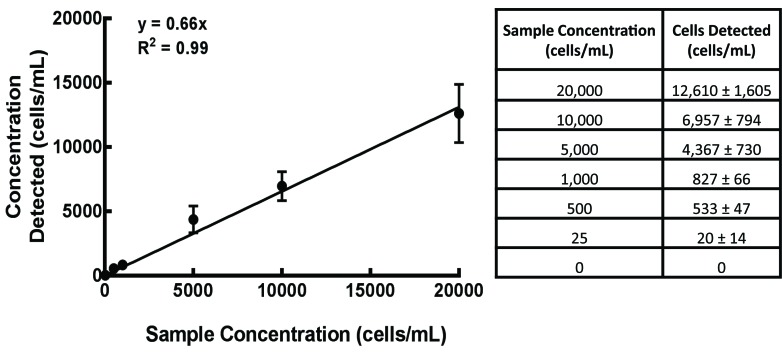
Figure 1. MIA PaCa-2-Luc-GFP calibration curve.
Luciferase and GFP expressing MIA PaCa-2 cells were added to whole blood in known concentrations. RBC lysis procedures were carried out and samples were analyzed by flow cytometry for tumor cell quantification. The concentration of cells detected correlated with its known concentration by a Pearson’s linear regression (y = 0.66x, r2 = 0.99, Mean ± SEM).

