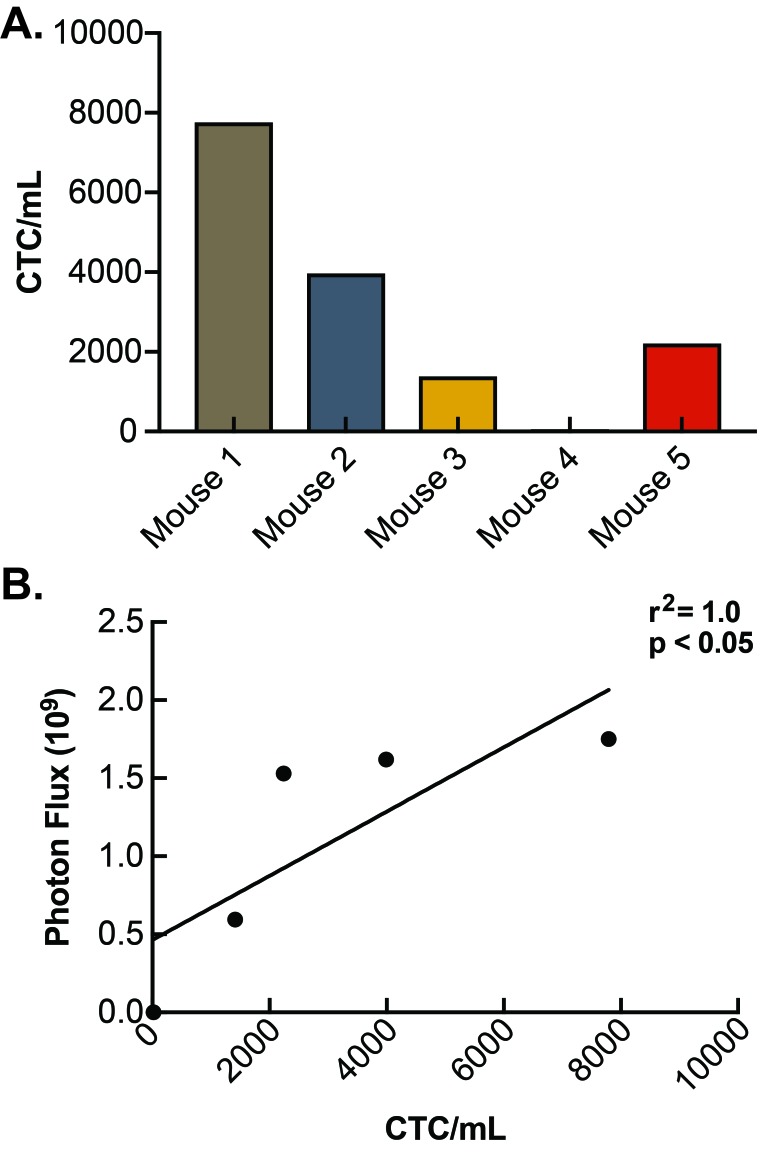
Figure 5. Determination of circulating tumor cell concentration.
A. CTC concentration (CTCs/ml) was determined for each mouse. Mouse #4 contained the lowest concentration (21 CTCs/ml) and mouse #1 contained the highest concentration (7791 CTCs/ml). B. Serum CTC concentration was plotted against overall final tumor burden and a Spearman’s rank correlation for linear regression confirmed correlation and was found to be significant (r2 = 1.0; P < 0.05).

