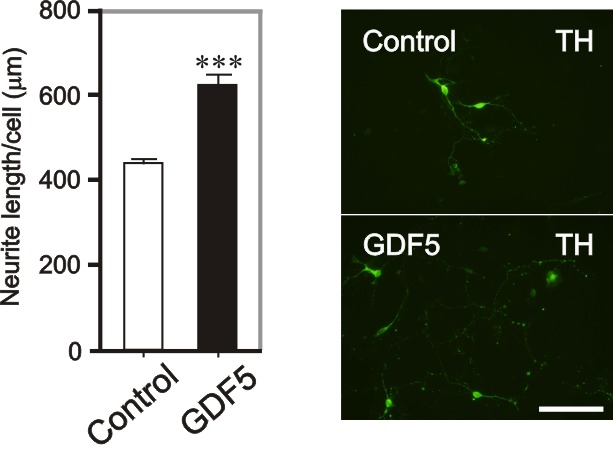
Figure 3.

Evaluation of potential neurotrophic strategies in VM DA neurons. Graph showing the total neurite length/cell and representative photomicrographs of TH-immunostained E14 VM DA neurons treated with control or GDF5 at 4 DIV. As indicated (***P < 0.001 vs. control; Unpaired student t-test; N = 3). Scale bar = 100 μm.
