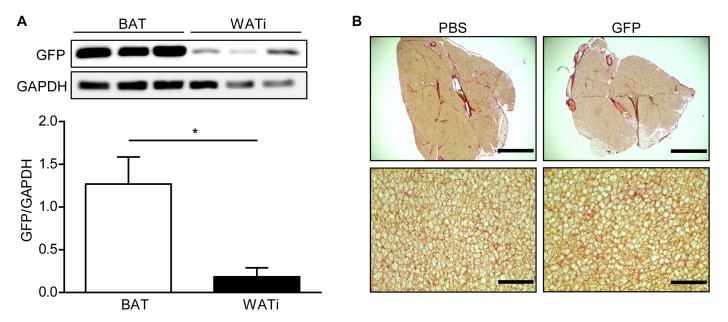
Figure 4.
Comparison of GFP expression in BAT and WATi and Sirius Red staining of BAT. A. GFP expression in BAT and WATi after injection of 1000 ng RT of lentivirus carrying GFP into each fat lobe assessed by Western blotting (top) and quantitative analysis (bottom). * P < 0.05 (n = 3). B. Representative BAT sections of PBS- and GFP-injected mice, stained with Sirius Red for collagen (I and III) fibres. Scale bar top = 1 mm; scale bar bottom = 100 µm.

