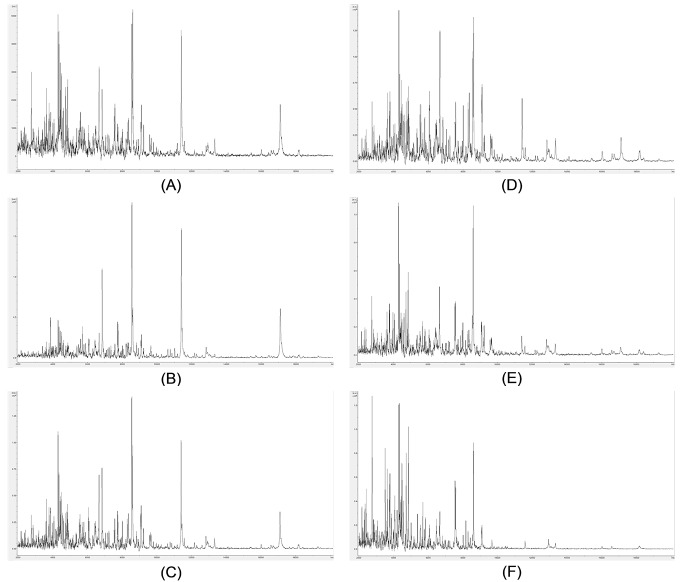
Figure 2. Example Pseudomomas syringae (IMI 349156) mass spectra from TFA-optimization titrations.
Example mass spectra (baseline-subtracted, smoothed, y-axis-autoscaled, and covering the mass range 2 kDa to 20 kDa) from TFA-optimization titrations, with 65% (v/v) acetonitrile, 10% (v/v) TFA, and saturated HCCA (A); 65% (v/v) acetonitrile, 5% (v/v) TFA, and saturated HCCA (B); 65% (v/v) acetonitrile, 2.5% (v/v) TFA, and saturated HCCA (C); 65% (v/v) acetonitrile, 1.25% (v/v) TFA, and saturated HCCA (D); 65% (v/v) acetonitrile, 0.63% (v/v) TFA, and saturated HCCA (E); and 65% (v/v) acetonitrile, and saturated HCCA (F).

