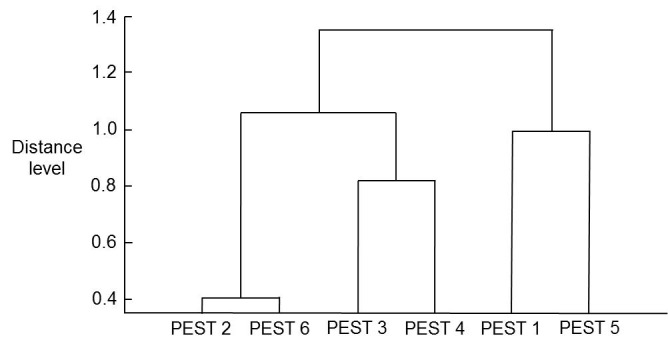
Figure 6. PCA dendrogram for the insect samples PEST 1 to PEST 6.

PCA dendrogram derived from the mass spectra for the insect samples PEST 1 to PEST 6 (figure redrawn from original Bruker image). Spectra were analyzed by PCA using the Bruker Online Client software to give the dendrogram. PCA analysis was unsupervised, and all peaks were weighted equally.
