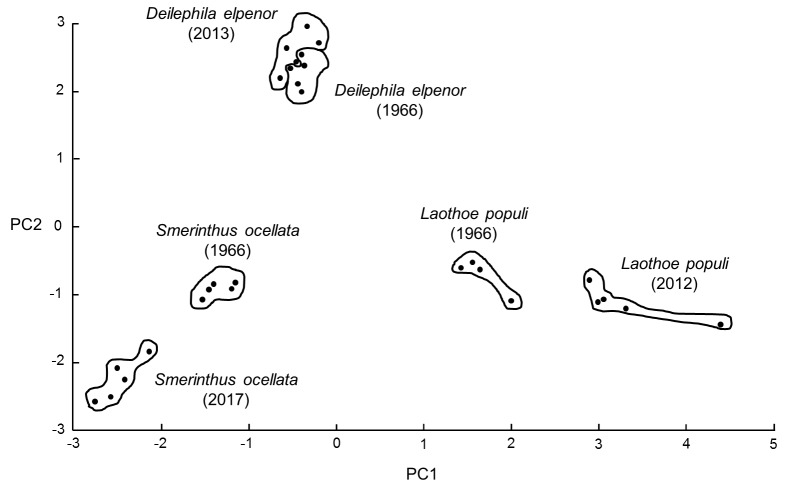
Figure 8. PCA ordination plot for old dried insect specimens.
PCA ordination plot for mass spectra generated by samples of Laothoe populi (1966), Smerinthus ocellata (1966), Deilephila elpenor (1966), Laothoe populi (2012), Smerinthus ocellata (2017), and Deilephila elpenor (2013) (figure redrawn from original Bruker image). Spectra were analyzed by PCA using the Bruker Online Client software, with the components of the first principal component vector shown in the X direction and the components of the orthogonal second principal component vector shown in the Y direction to give the ordination plot. PCA analysis was unsupervised, and all peaks were weighted equally.

