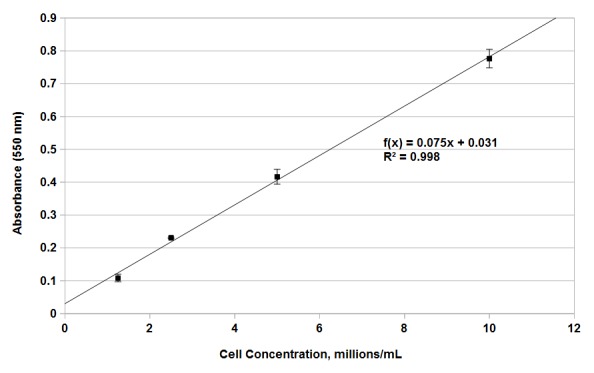
Figure 2. Correlation between cell number and absorbance at 550 nm.

Stationary phase aging yeast cultures were combined with RCL assay reagent containing menadione and glucose, incubated for 4 h, combined with solubilization reagent, and absorbance determined at 550 nm. Mean absorbance is plotted on the y-axis against cell concentration on the x-axis. Error bars represent the standard error of three independent replicates.
