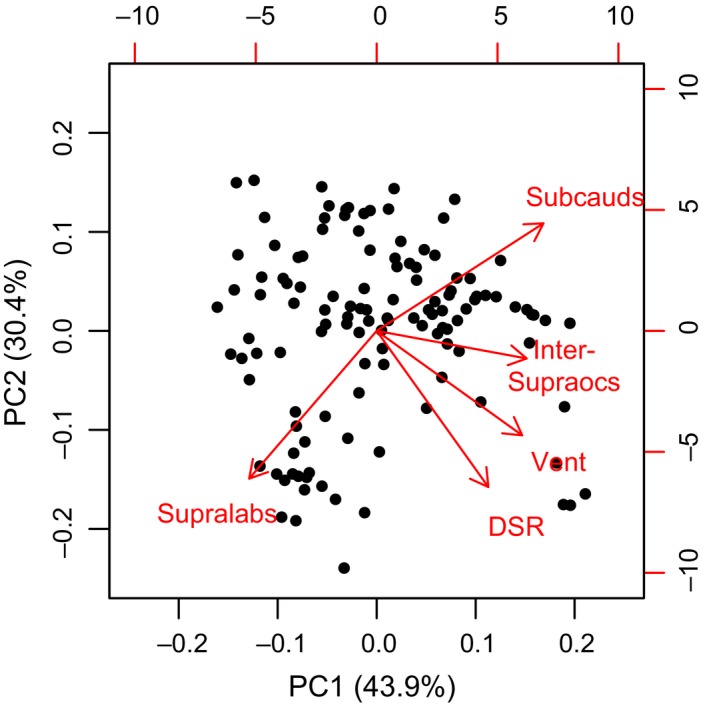
Figure 2.

Biplot displaying the relationship of scale counts to the two primary axes of the principle components analysis (PCA). The percentages on the axis labels represent the amount of variation in the scale data explained by each axis, cumulating to over 74% of the total variation. Vector directions represent the rotations of each variable on the axes, and vector lengths represent how well each variable is represented by each axis
