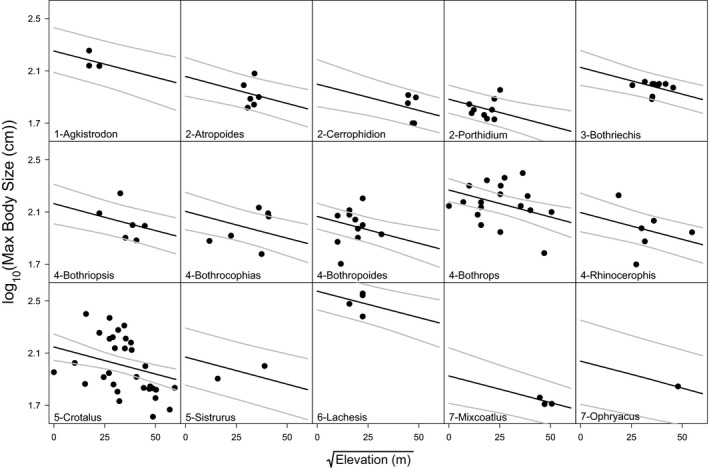
Figure 5.

The relationship between maximum body size and elevation for each genus. Unique intercepts result from the significant random effect on the intercept, where genus is nested within clade. The gray lines represent the 95% confidence prediction intervals taking into account the uncertainty in the intercepts and the overall slope. Clades are represented by the number preceding the genus labels
