. 2019 Jul 30;8:e46500. doi: 10.7554/eLife.46500

Figure 2. Comparison of the active and pseudoactive Cas9-nucleic acid complex structures and proposed mechanism for DNA cleavage activation of Cas9.

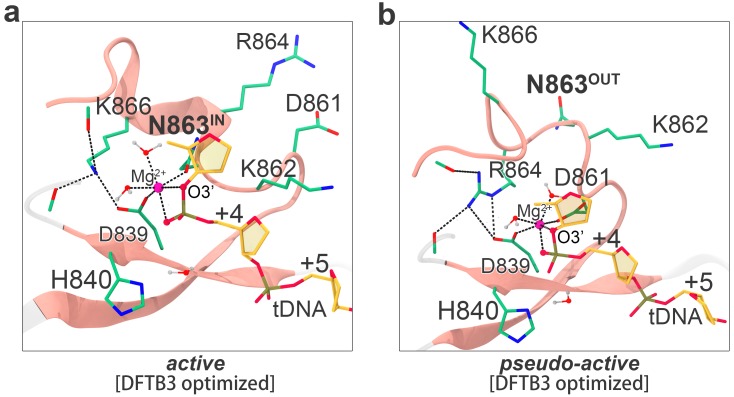
(a–b) Zoomed-in view (a) and zoomed-out view (b) of the HNH domain docked onto the tDNA and REC lobe in the optimized pseudoactive state. (c) Close-up view of the catalytic configuration of the T4 Endo VII (N62D) ββα-Me motif complexed with a DNA substrate. (d–f) Zoomed-in views (d, f) and zoomed-out view (e) of the HNH domain docked onto the tDNA and REC lobe in the catalytically active state. (g) Schematic diagram of the proposed mechanism underlying Cas9 HNH domain conformational activation.

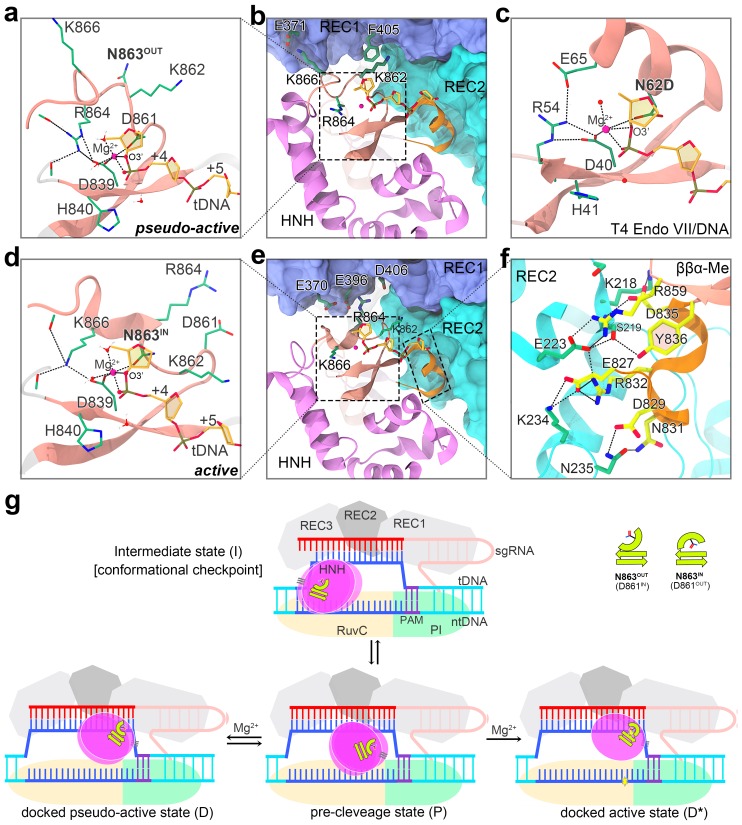
Figure 2—source data 1. Atomic coordinates of active Cas9-gRNA-DNA complex (in PDB format).
DOI: 10.7554/eLife.46500.018

Figure 2.

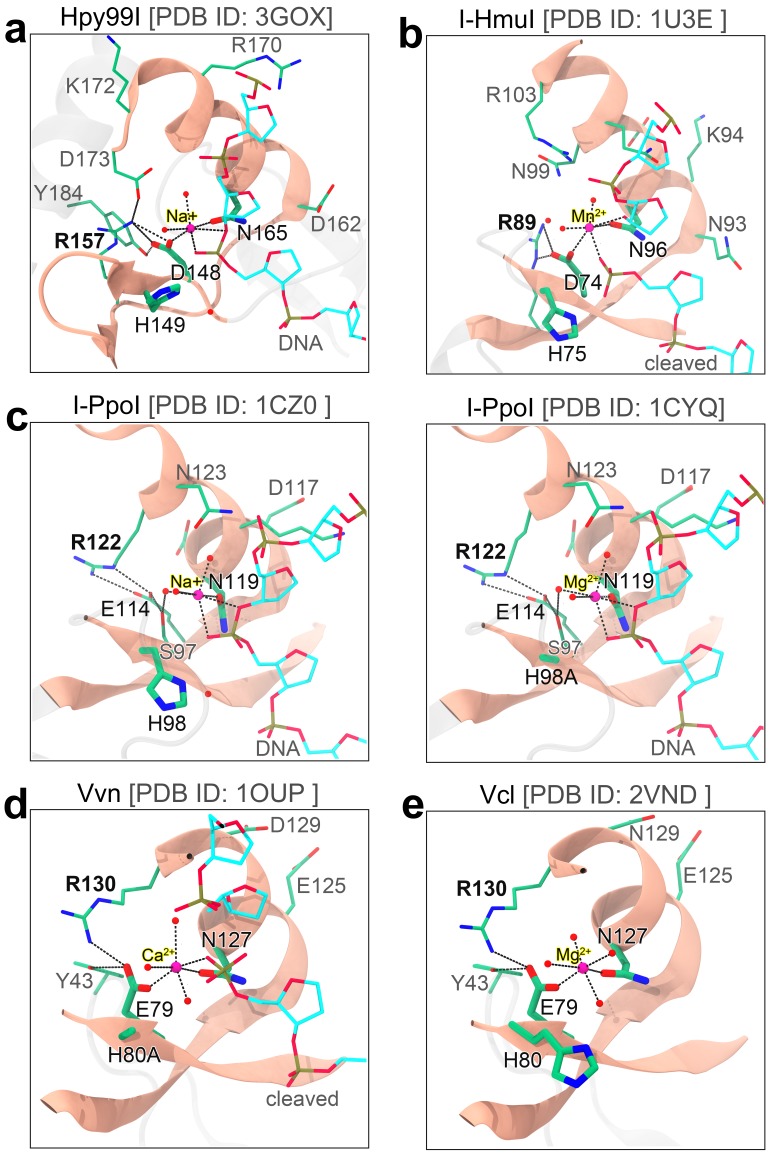
Figure 2—figure supplement 1. Close-up view of the catalytic centers of some representative ββα-Me superfamily members beyond Cas9.

Figure 2—figure supplement 1.

(a) Type II restriction endonuclease Hpy99I; (b–c) Homing endonucleases I-HmuI (b) and I-PpoI (c); (d) non-specific periplasmic nuclease from Vibrio vulnificus (Vvn); and (e) Endonuclease I from Vibrio cholerae (Vcl). See also Figure 2c for the Holliday Junction resolvase phage T4 Endo VII.

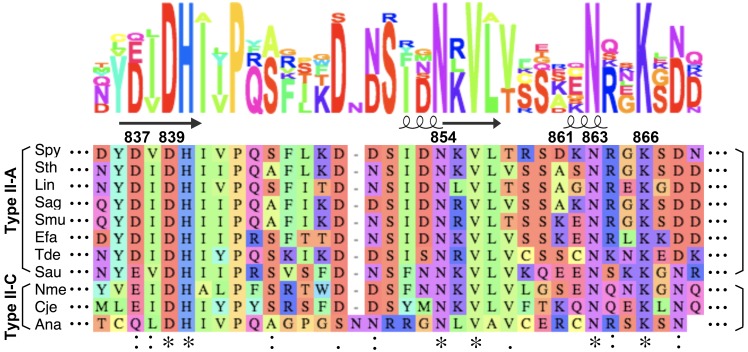
Figure 2—figure supplement 2. Multiple sequence alignment of Type II-A and Type II-C Cas9 orthologs focusing on the ββα motif regions.

Figure 2—figure supplement 2.

The primary sequences of Type II-A Cas9 orthologs from Streptococcus pyogenes (Spy, GI 15675041), Streptococcus thermophilus LMD-9 (Sth, GI 11662823), Listeria innocua Clip 11262 (Lin, GI 16801805), Streptococcus agalactiae A909 (Sag, GI 76788458), Streptococcus mutans UA159 (Smu, GI 4379809), Enterococcus faecium 1231408 (Ffa, GI 257893735), Treponema denticola (Tde, WP_002676671.1), and Staphylococcus aureus (Sau, GI 1027923597), together with Type II-C Cas9 orthologs from Neisseria meningitidis (Nme, WP_019742773.1), Campylobacter jejuni (Cje, WP_002876341.1) and Actinomyces naeslundii str. Howell 279 (Ana, EJN84392.1) were aligned using Cluster Omega. The alignment was illustrated by MSAViewer with default settings. The secondary structures of SpyCas9 from its apo-state crystal structure (PDB code: 4CMP) are represented at the top of the sequence alignment diagram, with the residue numbers indicated below.

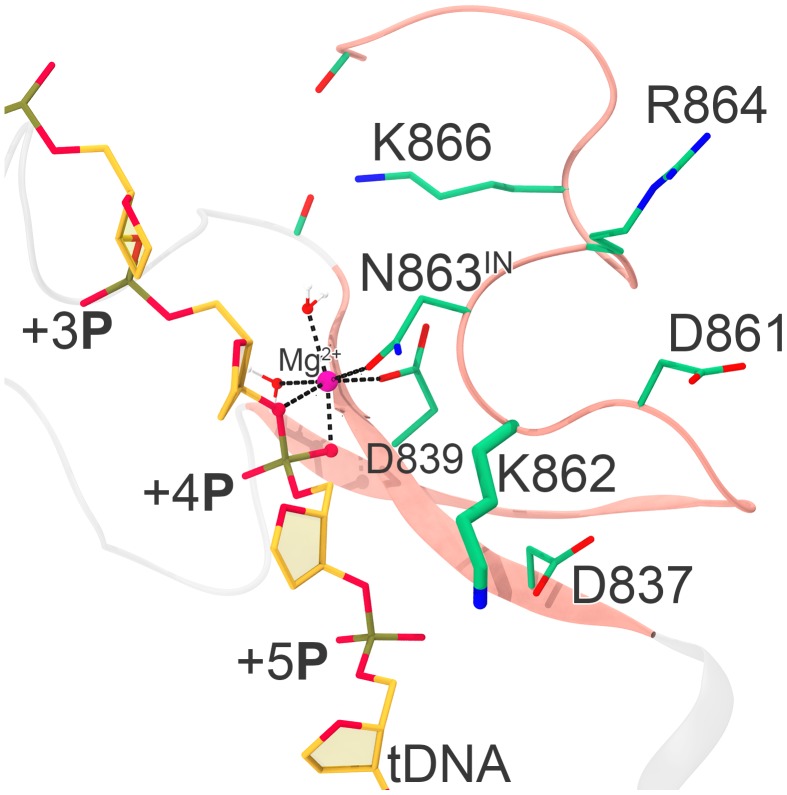
Figure 2—figure supplement 3. Lys862 making interactions with Asp837 and/or tDNA as captured in another simulation trajectory of the active state Cas9 complex.

Figure 2—figure supplement 3.

The ββα-Me motif is represented by pink ribbons, and the residues is depicted as stick models and colored by atom types (C, dark green; N, blue; O, oxygen). The Mg2+ is rendered as a magenta sphere. For the tDNA, only the phosphate-sugar backbone is shown for clarity. The dashed lines denote coordination bonds.

Figure 2—figure supplement 4. Interactions between the REC2 domain (colored cyan) and the HNH domain formed in the pseudo-active Cas9 complex structure.

Figure 2—figure supplement 4.

The residues on the REC2 and HNH domains are colored by green and yellow, respectively. The dashed lines indicate hydrogen bonds or salt bridges.

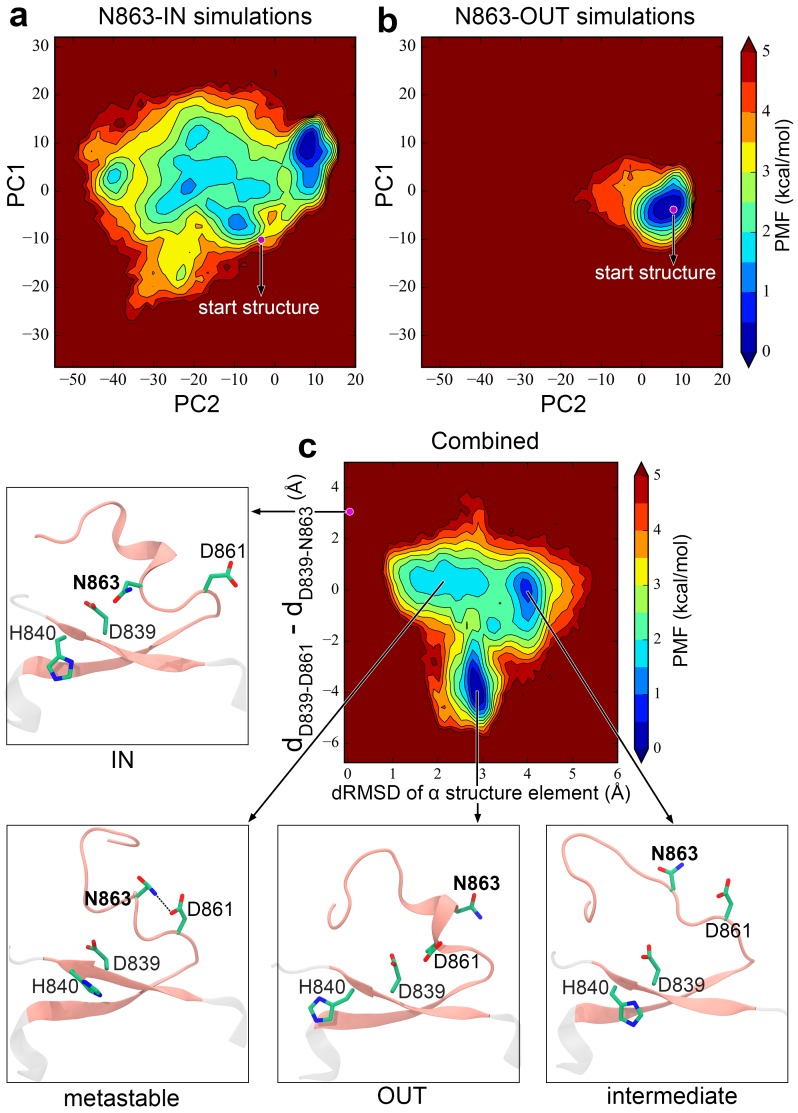
Figure 2—figure supplement 5. Free energy landscapes of the α structure element (residues 859 to 872) in the ββα-Me motif against different sets of reactions coordinates.

Figure 2—figure supplement 5.

(a)-(b) Free energy landscapes of the α structure element as obtained based on the principal component analysis of the replicated simulations initiated from the N863-IN (a) and N863-OUT (b) state. (c) Free energy landscape of the α structure element derived from the combined sets of simulations. The total sampling time adds up to 50 μs and the Cα atoms are selected for the present calculations. In deriving the landscapes in (a) and (b), the simulation trajectories (500,000 snapshots in total) of each state are projected onto the same subspace defined by the two principal components (i.e., PC1 and PC2) that are calculated over the combined trajectories (1000,000 snapshots). The starting structure for each system is mapped on the PC1-PC2 plane, highlighted with a circle filled in magenta. The free landscape in (c) are constructed from the combined sets of simulations for the N863-IN and N863-OUT state, against the distance RMSD (dRMSD) with reference to the N863-IN simulation starting structure (marked with a magenta circle) and the difference in distances of D839-D861 (dD839-D861) and D839-N863 (dD839-N863). Note that dRMSD compares pairs of internal distances (not absolute coordinates) and is thus insensitive to translations and rotations. The representative structures at the prominent minima are illustrated below panel (c).

Figure 2—figure supplement 6. The MD-derived metal center configuration in the active (a) and psuedoactive state (b) optimized by DFTB3 QM/MM simulations.

Figure 2—figure supplement 6.

The drawing style and coloring scheme are as in Figure 2a and Figure 2d. Remarkable similarities have been observed at the metal center by the QM/MM simulations, confirming the desirable accuracy of the current metal ion model in MD simulations.

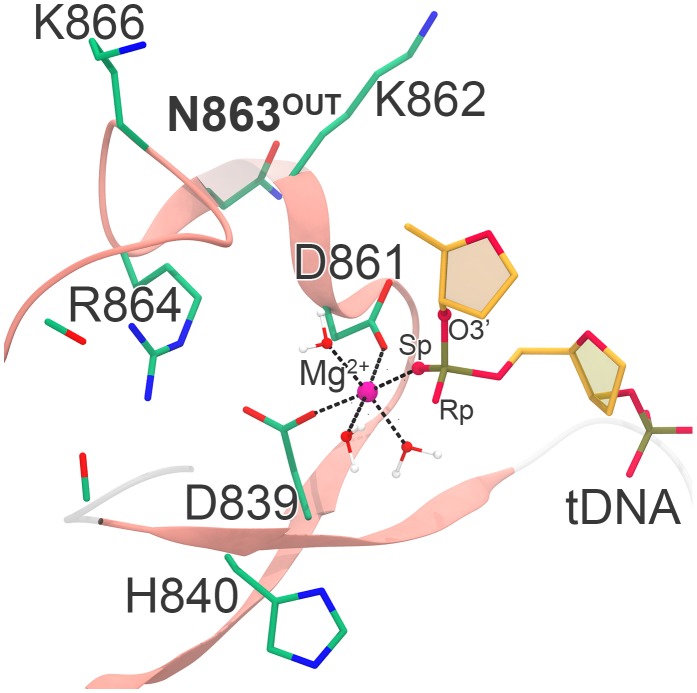
Figure 2—figure supplement 7. The coordination configuration at the HNH domain active center from our original pseudo-active Cas9 complex structure derived by use of the 12–6 point-charge Mg2+ model (viz. the normal usage set in AMBER force field).

Figure 2—figure supplement 7.

In this structure, the active center Mg2+ lost one critical coordination bond with the leaving group O3’ as compared to the catalytic configuration captured in the homologous T4 Endo VII in complex with a DNA substrate (Figure 2c). Here we refined this structure using an advanced multisite Mg2+ model based on a 12-6-4 LJ potential, and the resulting active center configuration (Figure 2a) well reproduced that in the T4 Endo VII system (Figure 2c).