. 2019 Aug 19;8:e47646. doi: 10.7554/eLife.47646

Figure 1. Cyclin B1 continues to be degraded during anaphase.

(a) Drosophila S2 cell from nuclear envelope breakdown to NER showing the different pools of Cyclin B1 in the mitotic apparatus. Scale bar is 5 μm. (b) Two neighbor HeLa cells (* indicates a cell that is slightly delayed relative to its neighbor; compare relative Cyclin B1 levels between neighbors as they exit mitosis) expressing exogenous H2B-mRFP and showing continuous degradation of endogenous Cyclin B1-Venus during anaphase. Scale bar is 5 μm. (c) Cyclin B1 degradation profile in Drosophila S2 cells (n = 4 cells) and in HeLa cells with endogenously tagged Cyclin B1-Venus (n = 3 cells). Fluorescence intensity values were normalized to 20 min before anaphase onset (A.O.). (d) Time-lapse images of dividing Drosophila follicle cells expressing endogenously tagged Cyclin B1-GFP and His2Av-mRFP. Scale bar is 5 μm. (e) Quantification of Cyclin B1-GFP fluorescence intensity in the cytoplasm (n = 8 cells, five ovaries). Fluorescence intensity values were normalized to 8 min before A.O. (f) Time-lapse images of a metaphase II oocyte expressing Cyclin B1-mCherry and stained with SiR-DNA undergoing anaphase II after parthenogenic activation. Inset is 1.5x magnification of separating chromosomes. (f’) Images of transmission light microscopy showing the same oocyte prior to and after imaging. Note the presence of the first and second polar bodies. Scale bar is 20 μm. (g) Quantification of Cyclin B1-mCherry fluorescence intensity in the cytoplasm (n = 20 oocytes, two independent experiments). Fluorescence intensity values were normalized to 6 min before anaphase onset. The LUT ‘fire’ is used to highlight Cyclin B1 localization in the different systems. Time in all panels is in min:sec.

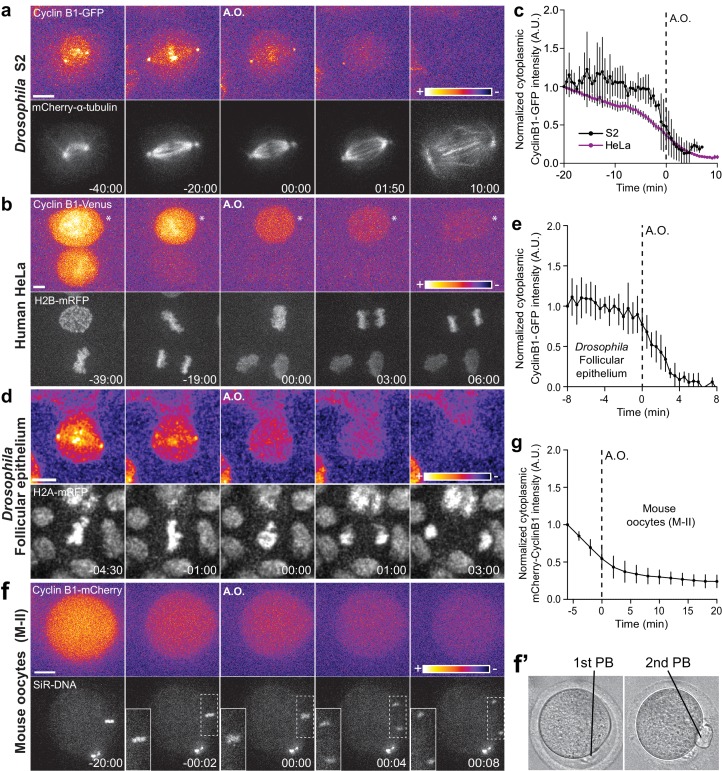
Figure 1.

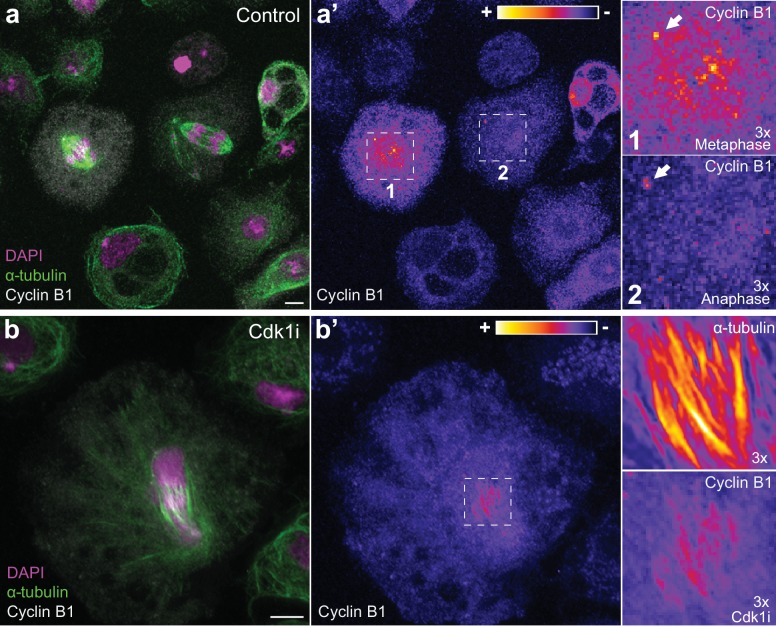
Figure 1—figure supplement 1. Endogenous Cyclin B1 is detectable on centrosomes in metaphase and anaphase and can localize to spindle midzone microtubules in Drosophila S2 cells.

Figure 1—figure supplement 1.

(a) Images of fixed Drosophila S2 cells co-stained for endogenous Cyclin B1 and α-tubulin. (a’) Highlight of Cyclin B1 levels with the LUT ‘fire’. Note the global decrease in endogenous Cyclin B1 levels from metaphase (1) to anaphase (2) (compare cytoplasmic pools). Nevertheless, early anaphase cells maintain a centrosome-associated pool of Cyclin B1 (white arrows in the magnifications). (b) Fixed Drosophila S2 cell co-stained for endogenous Cyclin B1 and α-tubulin and induced to exit mitosis through Cdk1 inhibition 10 min before fixation. (b’) Highlight of Cyclin B1 and α-tubulin staining with the LUT ‘fire’. Co-localization of endogenous Cyclin B1 and microtubules can be observed in cells exiting mitosis. Scale bar is 5 μm.
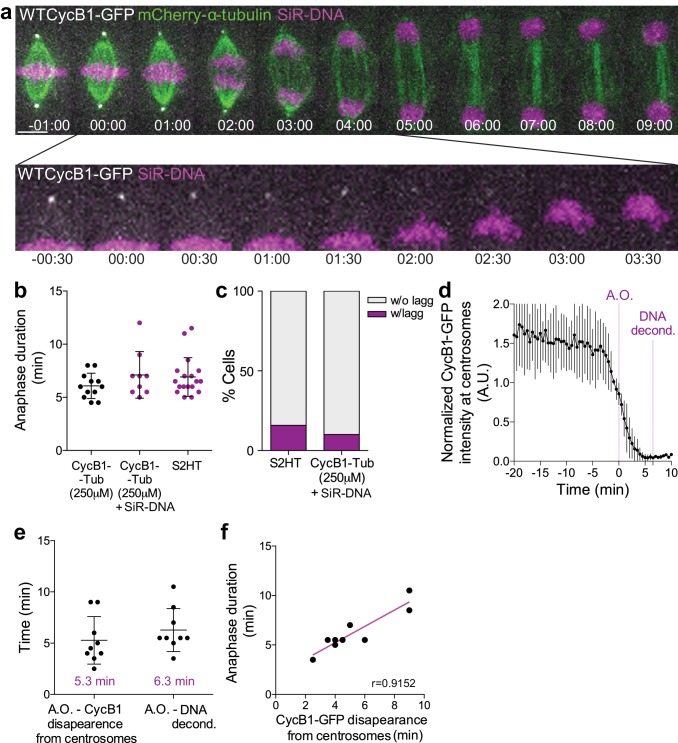
Figure 1—figure supplement 2. Cyclin B1 degradation during anaphase correlates with DNA decondensation.

Figure 1—figure supplement 2.

(a) Control Drosophila S2 cell stably expressing Cyclin B1-GFP/mCherry-α-tubulin and stained with SiR-DNA to follow mitotic chromosomes. Cyclin B1-GFP localization and degradation on centrosomes during anaphase is highlighted. Scale bar is 5 μm. Time is in min:sec. (b) Comparison of anaphase duration between Drosophila S2 cells expressing Cyclin B1-GFP/mCherry-α-tubulin, the same cells with SiR-DNA or cells expressing H2B-GFP/mCherry-α-tubulin. Differences between experiments are not significant, as tested with a nonparametric Mann-Whitney test. (c) Frequency of Drosophila S2 cells with lagging chromosomes in the same samples as in (b). In both (b) and (c) SiR-DNA had no impact on anaphase progression or chromosome segregation fidelity. (d) Quantification of Cyclin B1-GFP fluorescence intensity at centrosomes (n = 6 cells). Fluorescence intensity values were normalized to metaphase (−20 min). A.O. = Anaphase onset. (e) Quantification of the time from A.O. to Cyclin B1-GFP disappearance from centrosomes and respective anaphase duration (anaphase onset to DNA decondensation) (n = 9 cells). (f) Correlation between Cyclin B1-GFP disappearance from centrosomes and anaphase duration (p=0.0011). A parametric Pearson correlation was computed for this analysis.
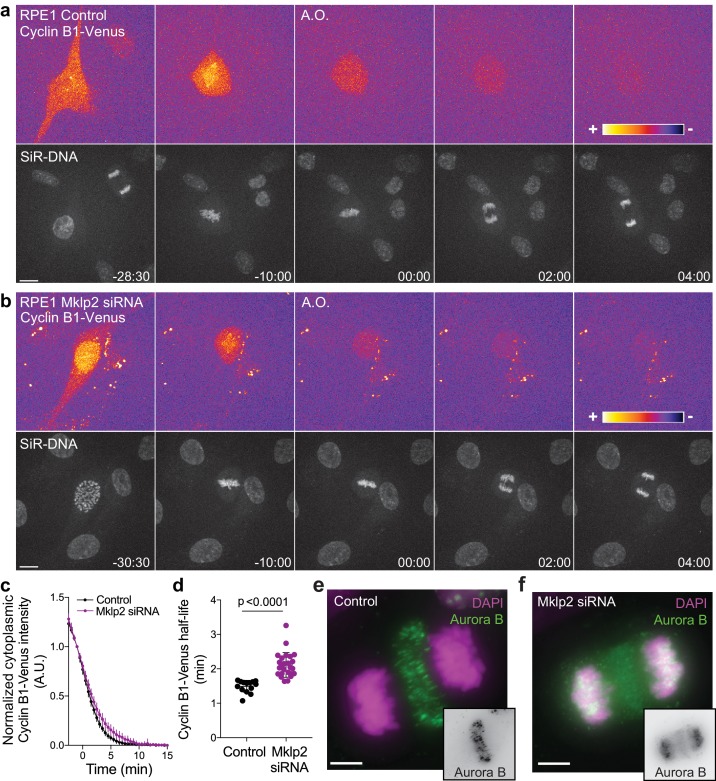
Figure 1—figure supplement 3. Aurora B localization at the spindle midzone impacts Cyclin B1 degradation during anaphase in hTERT-RPE1 cells.

Figure 1—figure supplement 3.

(a) and (b) Representative examples of a control and Mklp2-depleted hTERT-RPE1 cells expressing endogenous Cyclin B1-Venus and co-stained with SiR-DNA. Cyclin B1-Venus localization and levels are highlighted with the LUT ‘fire’, showing detectable levels of Cyclin B1 during anaphase. Time is in min:sec (c) Degradation profile of Cyclin B1-Venus in control (n = 14 cells) and Mklp2 siRNA (n = 25 cells, pooled from two independent experiments). Anaphase onset = 0 min. (d) Calculated Cyclin B1-Venus half-life (0–4.5 min after anaphase onset). Statistical significance was tested with a nonparametric Mann-Whitney test. (e) and (f) Aurora B staining in control and Mklp2-depleted hTERT-RPE1 cells from the same experiment shown in the live imaging in (b). Mklp2 siRNA shows a strong impairment of Aurora B translocation from chromosomes to the spindle midzone. Scale bars are 5 μm.
Figure 1—figure supplement 3—source data 1. Cyclin B1-Venus half-life in control and Mklp2-depleted cells.
DOI: 10.7554/eLife.47646.006