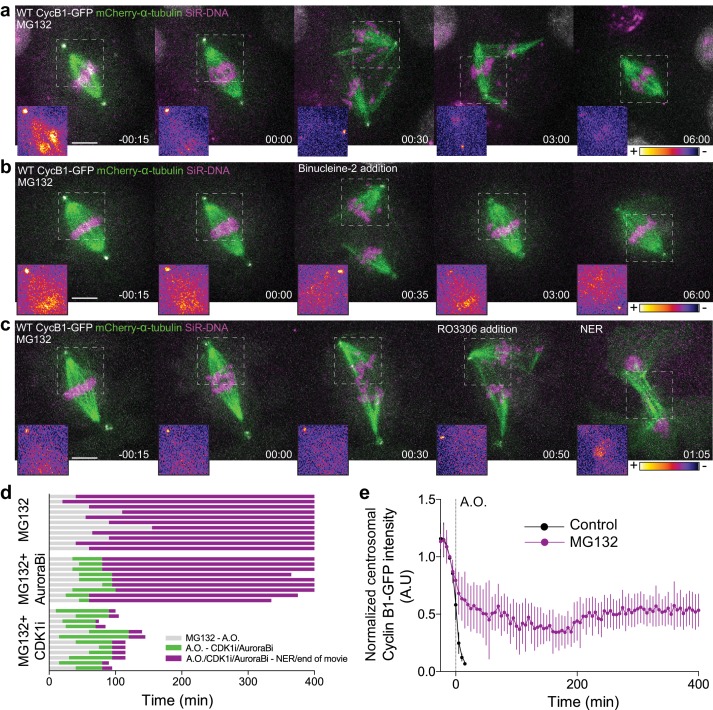
Figure 3. Cdk1 inactivation during anaphase licenses mitotic exit and requires proteasome-mediated proteolysis.
(a) Representative Drosophila S2 cell stably expressing Cyclin B1-GFP/mCherry-α-tubulin and stained with SiR-DNA to follow mitotic chromosomes, showing a strong anaphase arrest after treatment with MG132 (20 μM). Importantly, cells entered anaphase with Cyclin B1 levels compared to untreated control cells, despite the presence of MG132. (b) and (c) Drosophila S2 cells arrested in anaphase with MG132, and treated with Aurora B inhibitor (Binucleine-2) or Cdk1 inhibitor (RO3306), respectively, 30–60 min after the anaphase arrest. In (a), (b) and (c) a half-spindle region is highlighted with the LUT ‘fire’ to reveal Cyclin B1-GFP fluorescence during the anaphase arrest. Scale bars in all panels are 5 μm. Time in all panels is in h:min. (d) Timeline of the experiments shown in (a), (b) and (c) with quantification of total anaphase duration. A.O. = Anaphase onset. Gray color represents the time from MG132 addition to anaphase onset in cases where cells entered anaphase in the presence of MG132. Green color represents the time spent in anaphase until Aurora B or Cdk1 inhibition and purple color represents the time spent in anaphase in the presence of MG132 or MG312+Aurora B inhibition or MG132+Cdk1 inhibition. (e) Cyclin B1-GFP degradation profile in untreated (n = 12 cells) and MG132-treated cells arrested in anaphase (n = 6 cells). A.O. = Anaphase onset.

