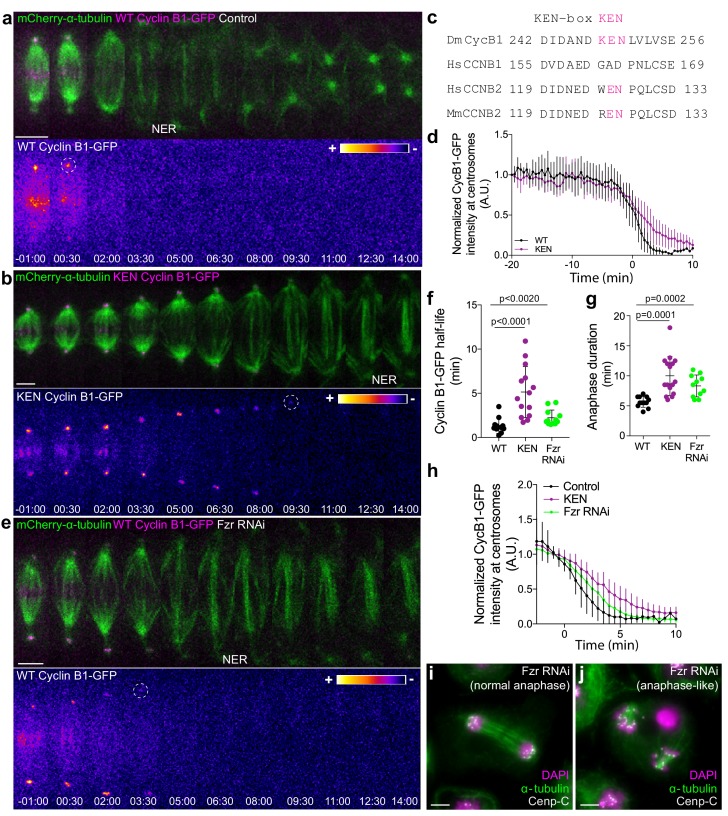
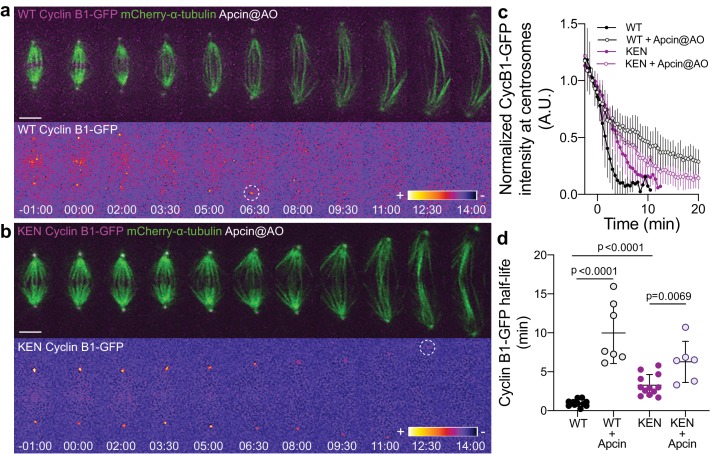
Figure 5. APC/CCdc20 and APC/CCdh1 are required for Cyclin B1 degradation during anaphase and timely mitotic exit.
(a) and (b) Drosophila S2 cells stably expressing WT Cyclin B1 or a KEN-box mutant version co-expressing mCherry-α-tubulin. (c) Sequence alignment showing the conservation of the Drosophila Cyclin B1 KEN-box with mammalian Cyclin B2, but not Cyclin B1. (d) Degradation profile of Cyclin B1-GFP quantified by measuring the GFP fluorescence intensity at centrosomes in control (n = 6 cells) and KEN-box mutant cells (n = 10 cells). Note that KEN-box Cyclin B1 degradation is only affected during anaphase. Anaphase onset = 0 min. (e) Drosophila S2 cell depleted of Fzr and expressing WT CyclinB1-GFP/mCherry-α-tubulin. Cyclin B1-GFP signal is highlighted with the LUT ‘fire’ and dashed white circles highlight the frame before Cyclin B1 signal disappearance from centrosomes. Scale bars are 5 μm. Time in all panels is in min:sec. (f) Quantification of Cyclin B1 half-life (0–4.5 min after anaphase onset) duration in control (n=11 cells), KEN-box mutant (n=12 cells) and Fzr-depleted cells (n=11 cells, pooled from 3 independent experiments) and (g) anaphase duration in control (n = 11 cells), KEN-box mutant (n = 16 cells) and Fzr-depleted cells (n = 12 cells, pooled from three independent experiments). Statistically significant differences for anaphase duration and CyclinB1 half-life were tested with an unpaired t-test and a nonparametric Mann-Whitney test, respectively. (h) Degradation profile of Cyclin B1-GFP quantified by measuring the GFP fluorescence intensity at centrosomes in control (n = 12 cells), KEN-box mutant cells (n = 14 cells) and Fzr-depleted cells (n = 12 cells). Anaphase onset = 0 min. (i) and (j) Images of anaphase Drosophila S2 cells after Fzr RNAi, fixed and co-stained with Cenp-C and α-tubulin. Note that amongst apparently normal anaphase cells (i), anaphase-like cells with clearly separated sister chromatids attached to two half-spindles could also be identified (j). Scale bars are 5 μm.


