. 2019 Aug 19;8:e47646. doi: 10.7554/eLife.47646

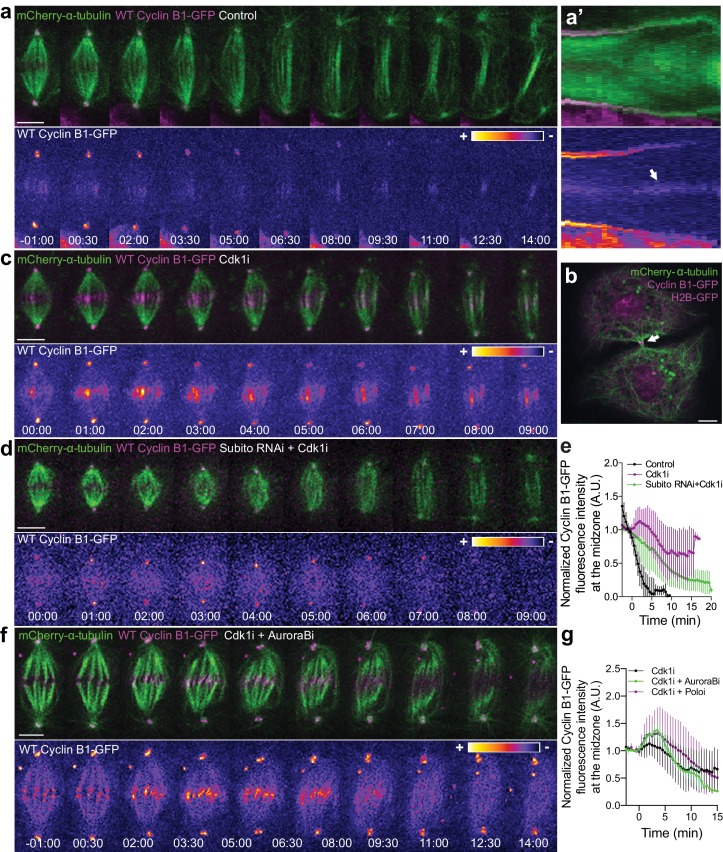
Figure 7. Cyclin B1 localization at the spindle midzone depends on Aurora B localization and activity during anaphase.

(a) Control Drosophila S2 cell stably expressing Cyclin B1-GFP/mCherry-α-tubulin showing a faint pool of Cyclin B1-GFP at the spindle midzone/midbody. (a’) Collapsed kymograph of the cell in a where Cyclin B1-GFP can be visualized at the spindle midzone/midbody. (b) Snapshot of a live Drosophila S2 cell expressing Cyclin B1-GFP/mCherry-α-tubulin where a midbody pool of Cyclin B1-GFP can be detected before completion of cytokinesis. (c) Drosophila S2 cell treated with Cdk1 inhibitor during metaphase. Cyclin B1 is not fully degraded and becomes visibly associated with midzone microtubules as cells are forced to exit mitosis. (d) Cdk1 inhibition at metaphase in a Drosophila S2 cell expressing Cyclin B1-GFP/mCherry-α-tubulin after Subito/Mklp2 depletion by RNAi. The Cyclin B1 midzone localization is no longer detectable. (e) Quantification of Cyclin B1-GFP fluorescence intensity measured at the spindle midzone (identified by the mCherry-α-tubulin signal) in untreated (n = 11 cells), Cdk1 inhibited cells (n = 10 cells) and Cdk1 inhibition after Subito/Mklp2 depletion (n = 12 cells, pooled from two independent experiments). (f) Drosophila S2 cells treated with Cdk1 inhibitor during metaphase and Aurora B inhibitor 4 min after Cdk1 inhibition. For all conditions, Cyclin B1-GFP signal is highlighted with the LUT ‘fire’. Scale bar is 5 μm. (g) Quantification of Cyclin B1-GFP fluorescence intensity measured at the spindle midzone in Cdk1 inhibited cells (n = 10 cells), Cdk1 + Aurora B inhibition (n = 11 cells) and Cdk1 + Polo inhibition (n = 10 cells).

Figure 7.

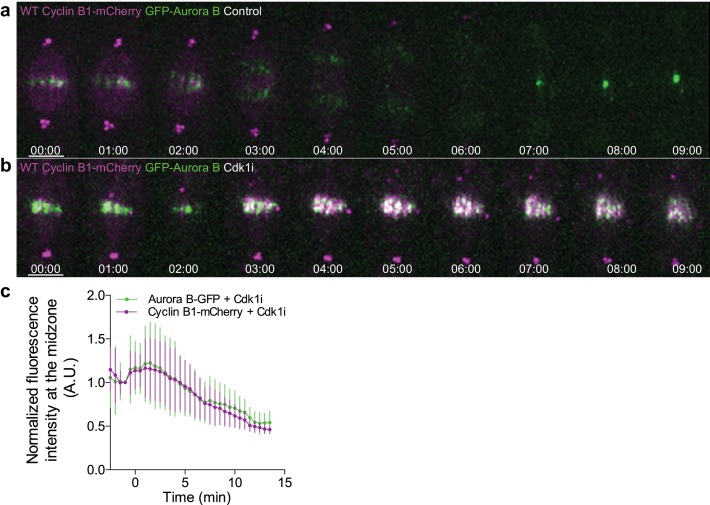
Figure 7—figure supplement 1. Cyclin B1 co-localization with Aurora B at the spindle midzone after Cdk1 inhibition in metaphase.

Figure 7—figure supplement 1.

(a) Untreated control Drosophila S2 cell or (b) treated with Cdk1 inhibitor in metaphase and expressing GFP-Aurora B/Cyclin B1-mCherry, showing a clear co-localization between both signals upon Cdk1 inhibition. Scale bars are 5 μm. Time is in min:sec. (c) Quantification of GFP-Aurora B and Cyclin B1-mCherry fluorescence signals at the spindle midzone after Cdk1 inhibition in metaphase (n = 7 cells).
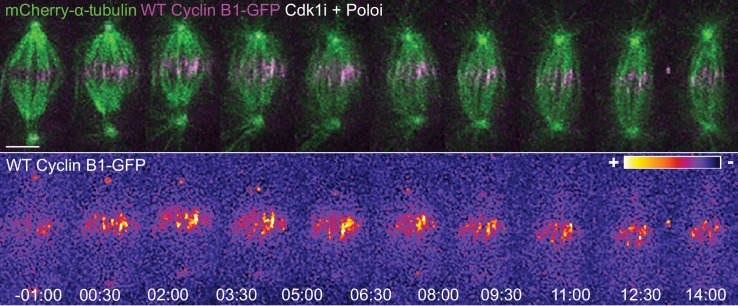
Figure 7—figure supplement 2. Cyclin B1 localization with midzone microtubules is not dependent on Polo kinase activity.

Figure 7—figure supplement 2.

Drosophila S2 cells treated with Cdk1 inhibitor during metaphase and Polo inhibitor 4 min after Cdk1 inhibition. Note that the microtubule localization of Cyclin B1 is not lost after Polo inhibition. Cyclin B1-GFP signal is highlighted with the LUT ‘fire’. Scale bars are 5 μm. Time is in min:sec.
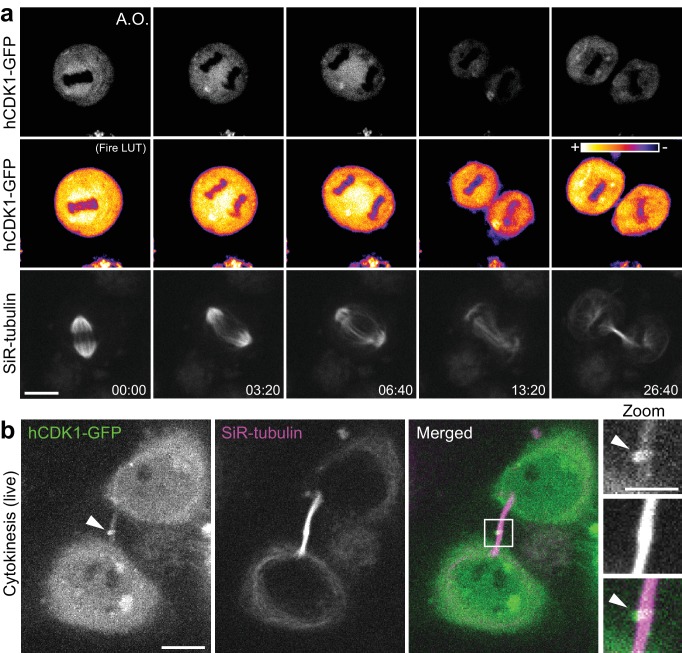
Figure 7—figure supplement 3. Cdk1 is enriched in the central spindle and midbody in human cells.

Figure 7—figure supplement 3.

(a) Sum projection of a 3D data set from a human HeLa cell transiently expressing hCdk1-GFP as cells enter and progress through anaphase and cytokinesis. Spindle and central spindle enrichment is highlighted with the LUT ‘fire’. Microtubules were visualized with SiR-tubulin. Scale bar is 10 μm. Time is in min:sec. (b) Snapshot from a live human HeLa cell transiently expressing hCdk1-GFP (green), with microtubules visualized with SiR-tubulin (magenta), showing enrichment at the midbody (arrowhead). Scale bar is 10 μm. Zoomed region highlights hCdk1-GFP localization at the midbody (arrowhead). Scale bar in the zoomed images is 5 μm.
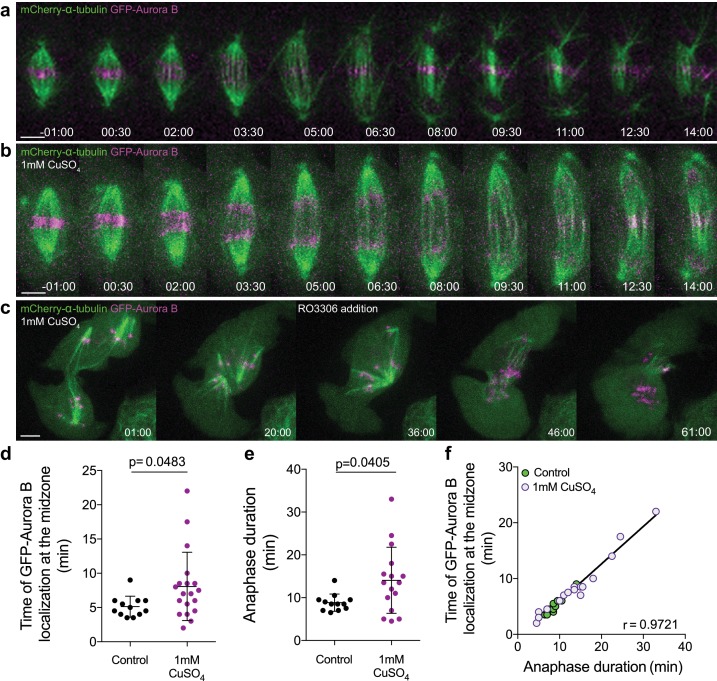
Figure 7—figure supplement 4. Aurora B overexpression induces a Cdk1-dependent anaphase delay.

Figure 7—figure supplement 4.

(a) Control Drosophila S2 cell stably expressing GFP-Aurora B/mCherry-α-tubulin. (b) Drosophila S2 cell overexpressing GFP-Aurora B where a delay in anaphase progression could be observed. (c) Cdk1 inhibition in a Drosophila S2 cell arrested in anaphase due to GFP-Aurora B overexpression. The cell exited mitosis immediately after drug addition. Scale bars are 5 μm. Time in all panels is in min:sec. (d) and (e) Quantification of the time of GFP-Aurora B recovery at the spindle midzone and anaphase duration, respectively, in control (n = 12 cells) and GFP-Aurora B overexpressing cells (treated with 1 mM CuSO4) (n = 19 cells). In both (d) and (e) statistical significance was tested with a nonparametric Mann-Whitney test. (f) Positive correlation (p<0.0001) between the time of Aurora B recovery at the spindle midzone and anaphase duration in control (n = 12 cells) and Aurora B overexpression (n = 16 cells). A nonparametric Spearman correlation was computed for this analysis.
Figure 7—figure supplement 4—source data 1. Anaphase duration after Aurora B overexpression.
DOI: 10.7554/eLife.47646.033