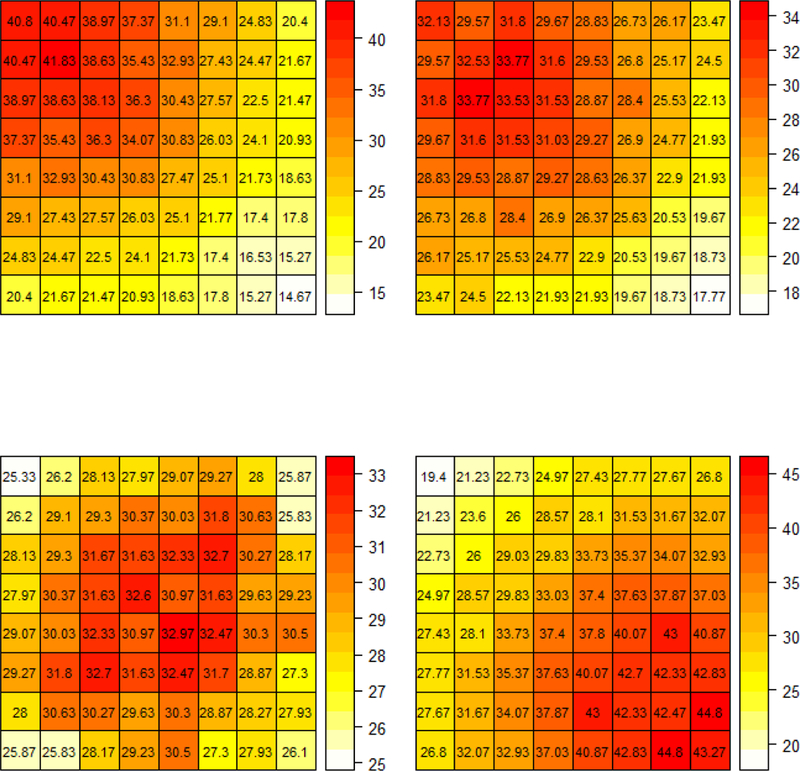
Figure 2. Simulation scenarios for comparing GLCM-based classifiers.

Each figure depicts the assumed mean rate surface used to simulate GLCM-derived patterns with different choices of c under s = 10. The upper-left is generated with c = 0, the upper-right is generated with c = 1, the lower-left is generated with c = 2, the lower-right is generated with c = 3.5
