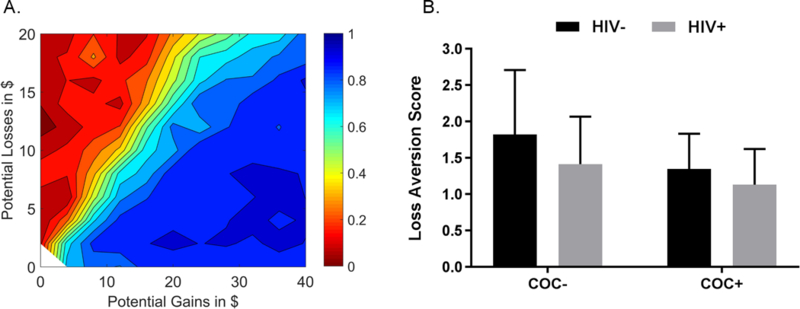
Figure 2.

A. Contour map illustrating the pattern of choices on the coin flip task for the sample as a whole. The probability of accepting the gamble ranged from 0 (red) to 1 (blue). Note: N= 68, as one COC-/HIV-participant completed only two out of the three runs. B. Bar graph illustrating mean loss aversion scores for each group (error bars represent standard deviation from the mean). COC-/HIV-participants had the highest scores (i.e., the greatest loss aversion) and COC+/HIV+ participant had the lowest scores (i.e., the least loss aversion).
