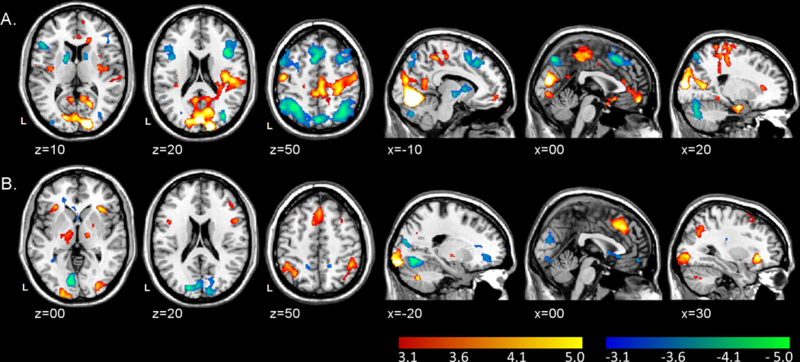
Figure 3.

A. Clusters of significant activation (red-yellow scale) and deactivation (blue-green scale) associated with increasing monetary gain values. B. Clusters of significant activation (red-yellow scale) and deactivation (blue-green scale) associated with increasing monetary loss values. Clusters were thresholded at z > 3.1 (p < .001) with ≥30 contiguous voxels for an overall false positive detection rate of p < .05. Color bars represent z-values.
