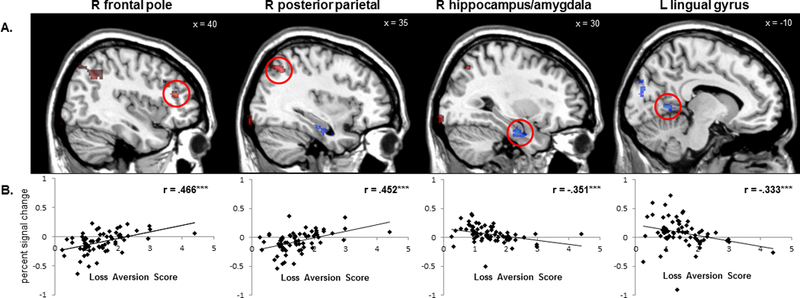
Figure 4.

A. Significant clusters of positive (red) and negative (blue) correlations between gain-related BOLD activation and behavioral loss aversion scores. B. Scatter plots of significant positive and negative correlations between gain-related BOLD activation and loss aversion scores (from left to right) in the right frontal pole, right posterior parietal cortex, right hippocampus/amygdala, and left lingual gyrus. Clusters were thresholded at z > 3.1 (p < .001) with ≥20 contiguous voxels for an overall false positive detection rate of p < .05.
