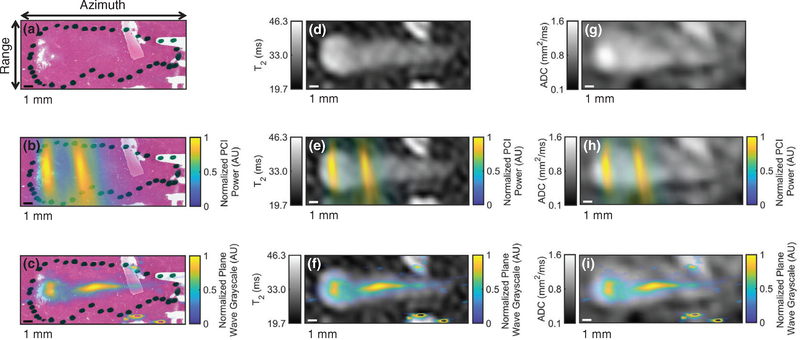
Figure 7.
Registration of imaging with histologic observation of liver sample liquefaction. (a) Hematoxylin and eosin (H&E) stain of liver sample exposed to histotripsy with the ablation zone indicated by the dotted black outline, (b) coregistration of passive cavitation imaging (PCI) acoustic power and H&E-stained liver sample, (c) coregistration of plane wave grayscale and H&E-stained liver sample, (d) parametric T2 map of treated liver sample, (e) coregistration of PCI acoustic power and T2 map, (f) coregistration of plane wave grayscale and T2 map, (g) parametric apparent diffusion coefficient (ADC) map of treated liver sample, (h) coregistration of PCI acoustic power and ADC map, and (i) coregistration of plane wave grayscale and ADC map. The histotripsy pulse (1 MHz fundamental frequency, 5 μs pulse duration, 25 MPa peak negative pressure) propagated from left to right in the image. The azimuth/range dimensions of the diagnostic ultrasound imaging plane are indicated in the panel (a). Reflections from connective tissue in (c), (f), and (i) have been removed for better windowing and visualization of the histotripsy bubble cloud.

