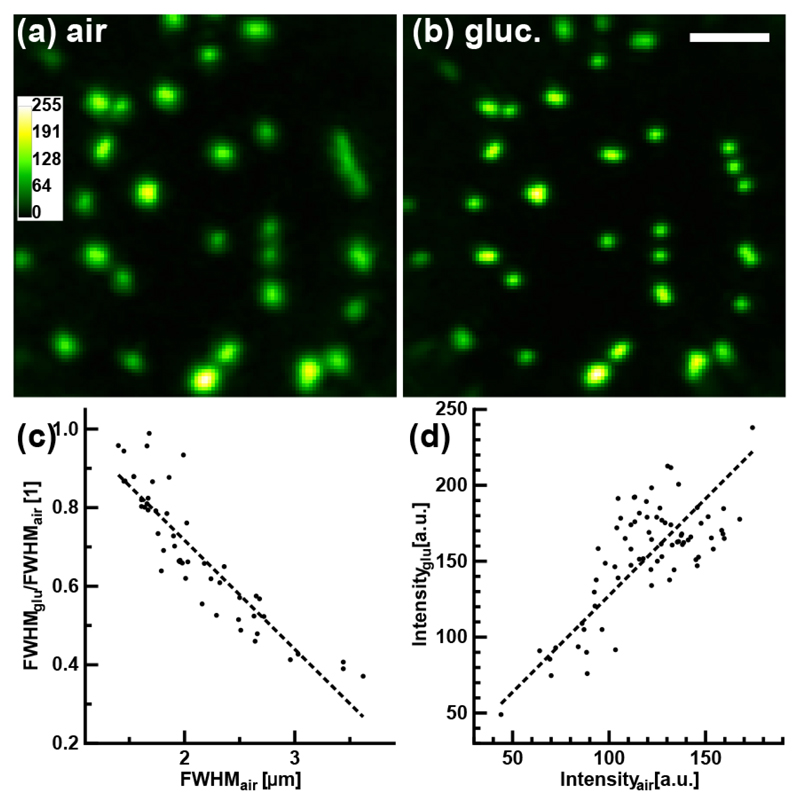
Fig. 3.
Imaging of fluorescent beads through a MMF. (a,b) Images of 1.0-μm beads acquired with the TM determined from a calibration in (a) air and (b) a 22% glucose solution. Scale bar: 10 μm. Images were normalized to the peak intensity in (b). (c) Graph of FWHM ratio for individual beads from images acquired with the glucose TM over that of the air TM as a function of the FWHM measured from images acquired with the air TM (n = 51, slope = −0.3 μm−1, R2 = 0.81). (d) Graph of the peak intensity for individual beads from images acquired with the glucose calibration as a function of the peak intensity measured from images acquired with the air calibration (n = 75, slope = 1.3, R2 = 0.47).

