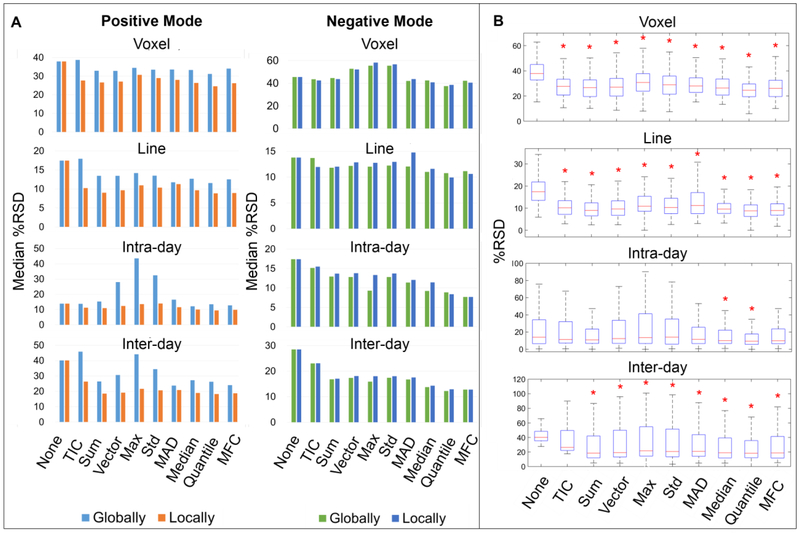
Fig. 5.
Comparison of the performance of global and local normalization on reducing signal variability. From top to bottom, the variability was measured at voxel level, line level, intra-day level and inter-day level. (A) Lower median %RSDs of positive mode data were achieved by applying local normalization. No improvement was found on negative mode data. (B) More locally normalized data in positive mode obtained significantly reduced variation (marked by red asterisk) than globally normalized ones (Figure 3A).

