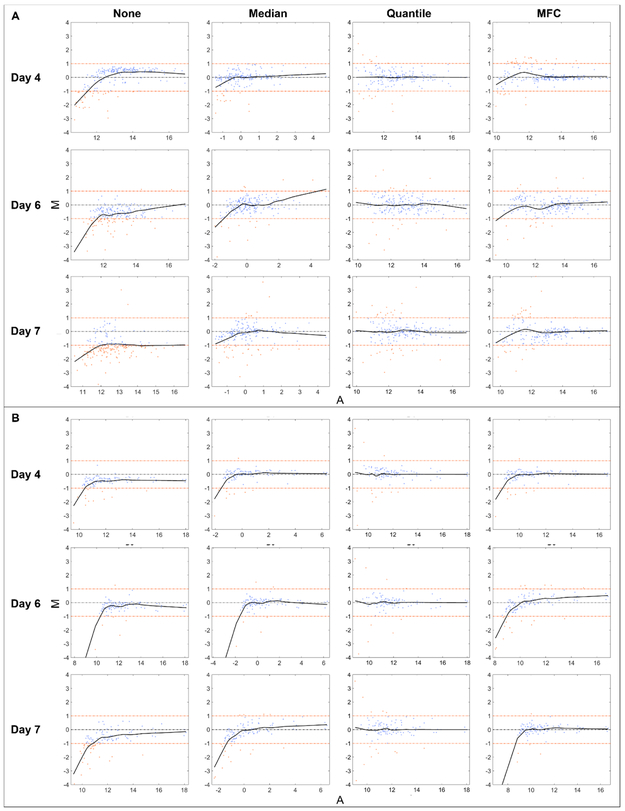
Fig. 6.
Representative MA plots in (A) positive and (B) negative mode under different normalization strategies. Spectra from different days were compared with day 1. Two horizontal fold-change lines marked in orange correspond to a ratio of 1 and −1 on a log2 (Ratio) scale, showing a fold-change level of 2. Each data point represents an ion, and those with 2-fold increased or decreased abundances are located outside of the fold-change lines and appear in orange. The black solid line is the Lowess smoothed line fitted to the data points with window size of 0.5 to visually exhibit the abundance-dependent bias.

