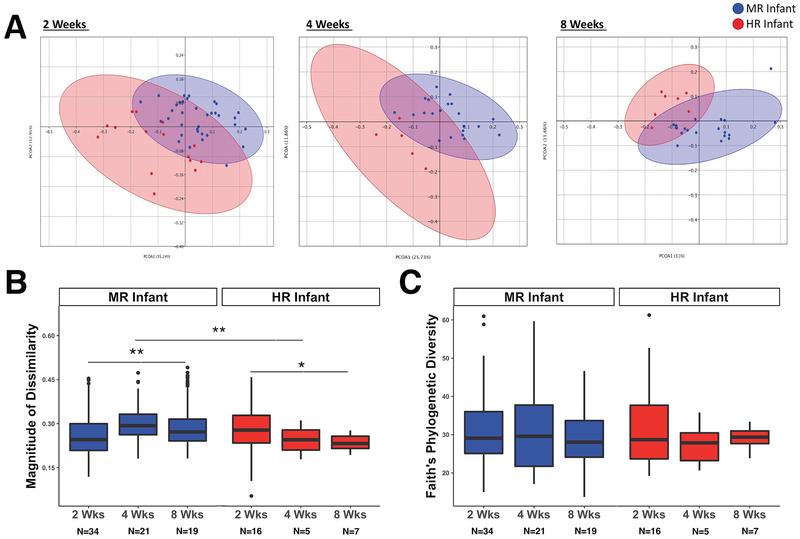
Figure 1.
Microbiome Diversity Indices across the first two months of life. A) Analyses of beta diversity based on weighted UniFrac distances between samples. Principal coordinates analysis with ellipses representing 95% confidence intervals shows clear separation of microbial profiles between MR and HR infants at 2, 4, and 8 weeks. B) Inter-individual distances illustrate the magnitude of dissimilarity in the profiles, which was significantly larger in HR infants at 2 weeks of age, but was lower than the microbial diversity across all MR infants at 4 and 8 weeks of age. C) Further categorization based on the phylogenetic analogue of taxon richness revealed no effect of rearing condition at any age point. Values are: box, median; whiskers, 25 and 75% quartiles; lines, 1.5 times the interquartile range. Outliers are illustrated by circles.
*, p<.01; **, p<.005.

