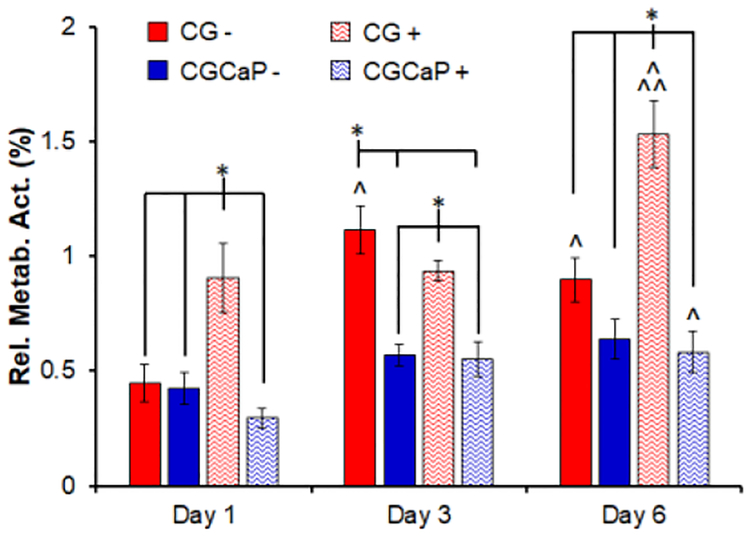
Figure 3.
Compartment-specific metabolic activity of MSCs across the osteotendinous scaffold (CG, CGCaP) with (+) or without (−) CTS (10min at 5% strain and 1 Hz) followed by 5 hours 50 minutes recovery at days 1, 3, and 6. Data expressed as mean ± SEM (n = 6). * Significantly higher (p < 0.05) than indicated groups at same day. ^ Significantly higher (p < 0.05) than same group on day 1. ^^ Significantly higher (p < 0.05) than same group on day 3.

