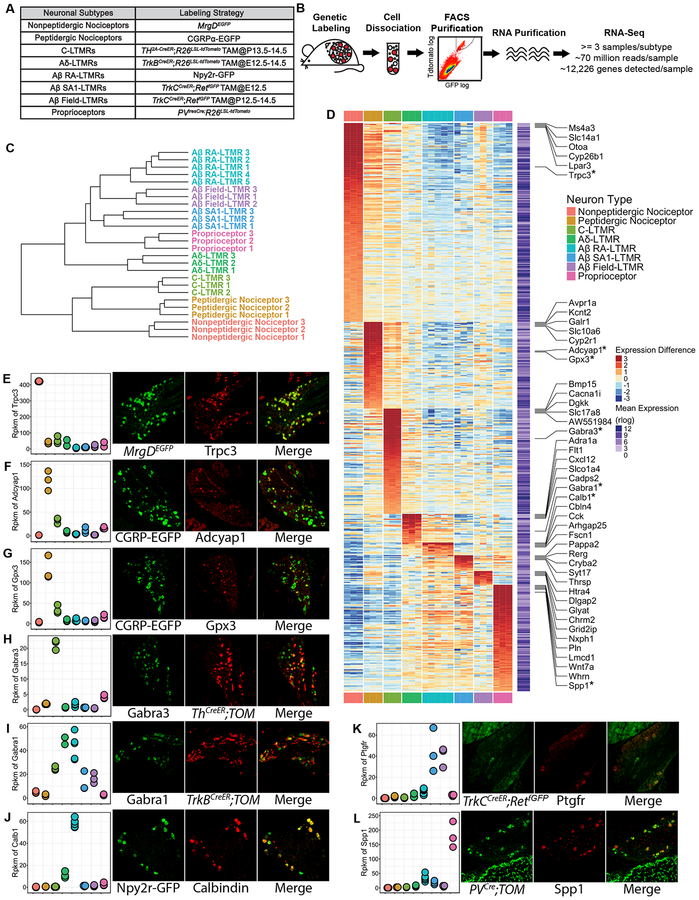
Figure 2. Transcriptome profiling of eight major DRG neuron subtypes.
(A) Genetic toolbox for labeling each of the eight DRG neuron subtypes.
(B) Schematic of the RNA-sequencing workflow.
(C) Hierarchical clustering of samples based on the expression (represented in rlog transformed count values) of the top 1000 genes that display the highest expression variance across samples using Euclidean distance.
(D) Heatmap depicting expression patterns of SUEGs. Expression (represented in rlog transformed count values) differences compared to the average expression levels for each gene are plotted in the main heatmap. Average expression level of a gene was calculated by averaging expression across all samples and is plotted in a second heatmap next to the main heatmap. Only highly expressed genes (average expression levels in the upper 75th percentile) were selected for this analysis. Genes are ordered based on the subtype in which expression is enriched, and their degree of enrichment. The top 5 most enriched genes for each of the neuronal subtypes are labeled. Genes whose expression were further tested with experiments as shown in (E-L) are labeled and marked with an asterisk.
(E-L) Left-most panels: Dotplots depicting expression levels of selected genes across subtypes in rpkm (reads per kilobase per million reads) values. Three right panels: Representative images of double immunostaining (E, H, I, J) or in situ hybridization (F, G, K, L) of fluorescent reporters and select genes using DRG sections from genetically labeled mice. Sensory neuron subtype reporters and tested genes are shown in separate channels, and the degree of overlap between the two is shown in the merged images. n=3 mice for (E-K), n=2 mice for L.
See STAR Methods for details.

