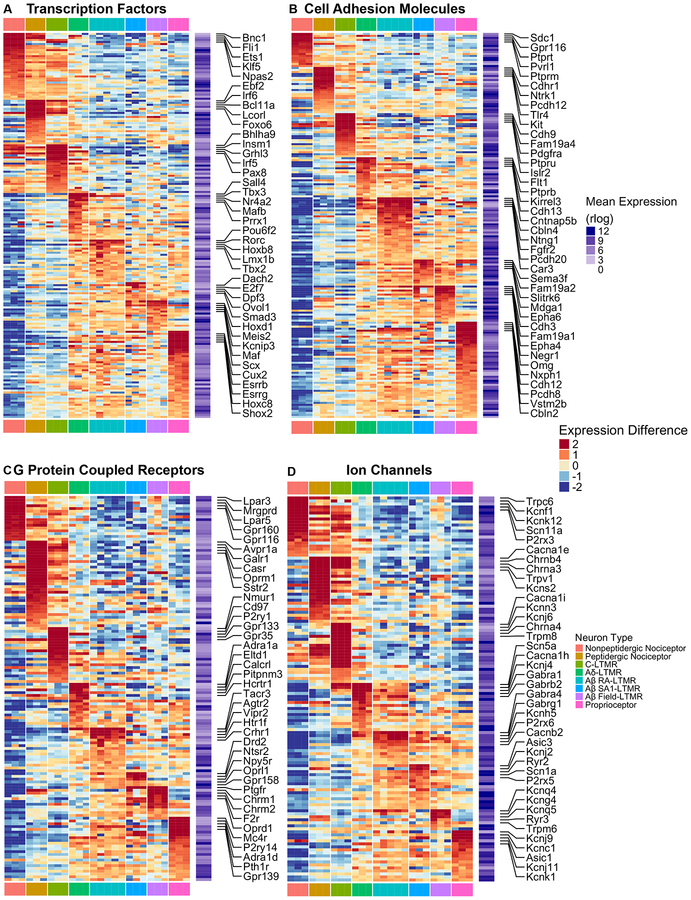
Figure 3. Functionally relevant genes are differentially expressed across DRG sensory neuron subtypes.
(A-D) Heatmaps depicting expression patterns for genes encoding transcription factors and transcriptional regulators (A), cell adhesion molecules (B), G protein-coupled receptors (C), and ion channels (D). Plotting scheme, calculation for average expression and expression deviation from average are the same as in Figure 2D. Only genes that are both highly expressed (average expression in the upper 75th percentile) and highly variable (at least three samples have an expression deviation from average larger than 1) were included in the heatmaps.
See STAR Methods for details.

