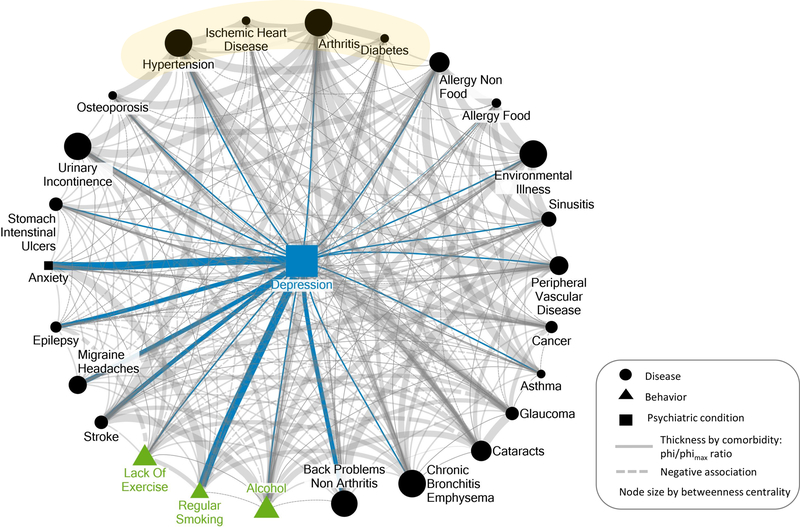
Figure 1.
Illustrative visualization of the centrality of depression in a network of multimorbid conditions and behaviors in 2,311 patients with complete data for all represented variables above in the Nova Scotia Health Survey 1995 (MacLean et al., 1996). Gray circular nodes represent medical conditions, blue rectangular nodes represent mood disorders (i.e., depression, anxiety), and green triangles represent unhealthy behaviors. The size of all circular and triangular nodes (i.e., all nodes other than depression) reflects degree of betweenness centrality. The betweenness centrality for depression was the fourth highest (17.18) out of all 26 nodes in the figure. The thickness of the lines connecting nodes represents the ratio of phi/phimax. That ratio was used as the visualized statistic for the association between each pair of nodes to adjust for differences in prevalence among the nodes. Only associations are represented for which the absolute value of the phi/phimax ratio was greater than or equal to .01. The values vary as follows: very thin lines: > = .01 and <.05; thin lines: >= .05 and <.15; medium thickness lines: > = .15 and <.20; thick lines: >= .20 and <.25; very thick lines: > = .25. Positive and negative associations are represented by solid and dotted lines, respectively. Blue lines highlight the associations with depression, and gray lines represent associations among nondepression nodes. See the online article for the color version of this figure.

