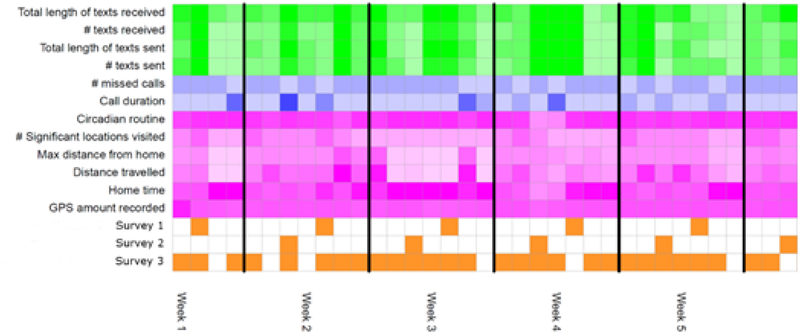
Figure 1. Visual display of daily summary statistics collected for a patient.
Surveys are represented in orange. Measures of mobility obtained from smartphone GPS are shown in purple. Measures from call logs are in blue and measures from text logs are in green. Measures are calculated from raw smartphone data on a daily basis. Only a smaller representative sample of the total set of measures both collected and calculated are displayed. Darker color represents a larger quantity/amount of the measure on a given day. Each column represents one day of data collection, with vertical black lines representing division between weeks.

