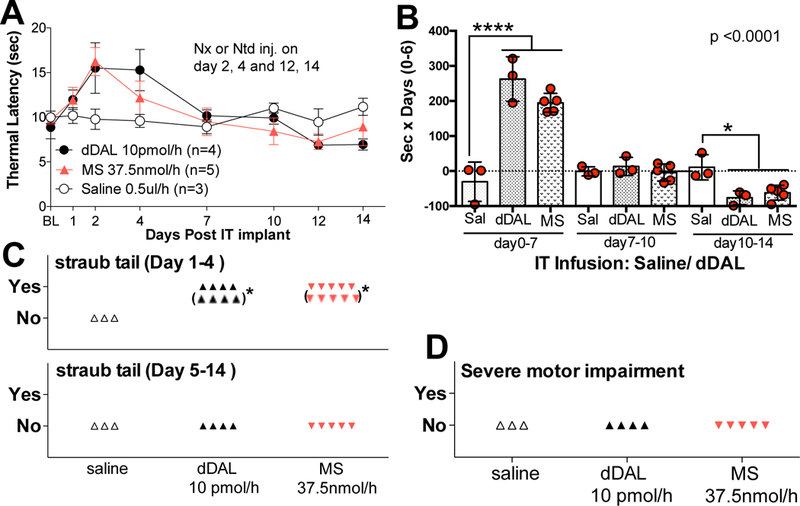
Figure 4:

(A) Time effect graph of IT DMT-DALDA (dDAL) infusion 10 pmol/hour (0.5 μl/hour of 20 pmol/μl, 14 days), morphine sulfate (MS) 37.5 nmol/hour (0.5 μl/hour of 75 nmol/μl, 14 days) or saline (Sal) vehicle. Bolus IP injections were made at day 2 or 4 and day 12 or 14 of naloxone or on the alternate days, naltrindole. (Results of effects of antagonists on thermal escape and withdrawal indices are presented in Figure 5). (B) Scatter graph of area under the curve (AUC) of each 3 phases of DMT-DALDA, morphine sulfate and saline vehicle (early: days 0–7, mid: days 7–10, late: days 10–14), excluding in each case the 6 hr window after IP antagonist treatments. These AUCs were compared using One-Way ANOVA followed by designated comparisons between d-DALDA or morphine vs. vehicle during three time windows after initiation of intrathecal infusion, using a t-test with Bonferroni adjustments to prevent alpha build up (*p<0.05 and ***p<0.001). (C) Scatter graph of the observance of Straub tail during the days 1–4 or 5–14 period (* behavior after naloxone and naltrindole administration). (D) Scatter graph of the observance of severe motor dysfunction at any time during the time course.
