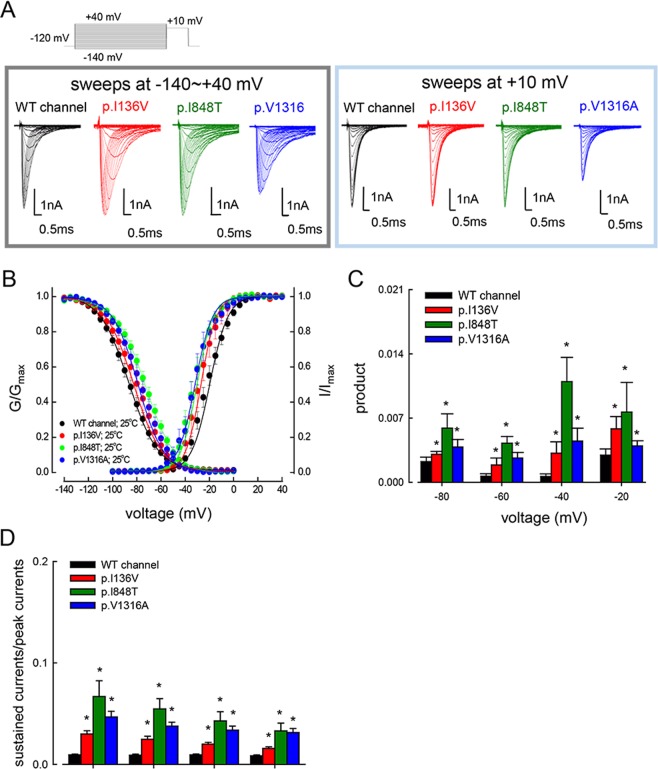
Figure 1.
Activation and inactivation curves of WT, p.I136V, p.I848T, and p.V1316A mutant channels. (A) Sample sweeps for the making of the activation (left panel) and inactivation (right panel) curves of the WT, p.I136V, p.I848T, and p.V1316A mutant channels in the presence of the Navβ4 peptide. (B) The activation and inactivation curves of the WT and mutant channels at 25 °C are fitted with a Boltzmann function of the form: 1/[1 + exp((Vh − V)/k)], where V is the membrane potential, Vh and k are −21.8 ± 1.5 mV and 8.3 ± 0.43 for the activation curve, and −85.7 ± 2.17 mV and −12.5 ± 0.33 for the inactivation curve in the WT channel; −27.5 ± 1.4 mV and 7.7 ± 0.23 for the activation curve, and −80.5 ± 1.2 mV and −12.8 ± 0.21 for the inactivation curve in p.I136V mutant channel; −32.6 ± 1.3 mV and 7.6 ± 0.23 for the activation curve, and −73.5 ± 1.3 mV and −12.5 ± 0.37 for the inactivation curve in the p.I848T mutant channel; and −34.04 ± 1.47 mV and 8.7 ± 0.34 for the activation curve, and −77.1 ± 0.9 mV and −11.9 ± 0.12 for the inactivation curve in the p.V1316A mutant channel, respectively (n = 5 for each measurement). (C) The product of G/Gmax and I/Imax at each voltage from part B is plotted against the voltage (i.e., −20, −40, −60, and −80 mV) in the WT, p.I136V, p.I848T, and p.V1316A mutant channels (*p < 0.05 between the WT and each mutant channel). (D) The ratio between the sustained (the average currents between 90 and 95 ms of the pulse) and peak (maximal) transient currents at +10 to +30 mV (see part A for the sample sweeps) is significantly larger in the p.I136V, p.I848T, and p.V1316A mutant channels in comparison with the WT channels (*p < 0.05 between the WT and each mutant channel).

