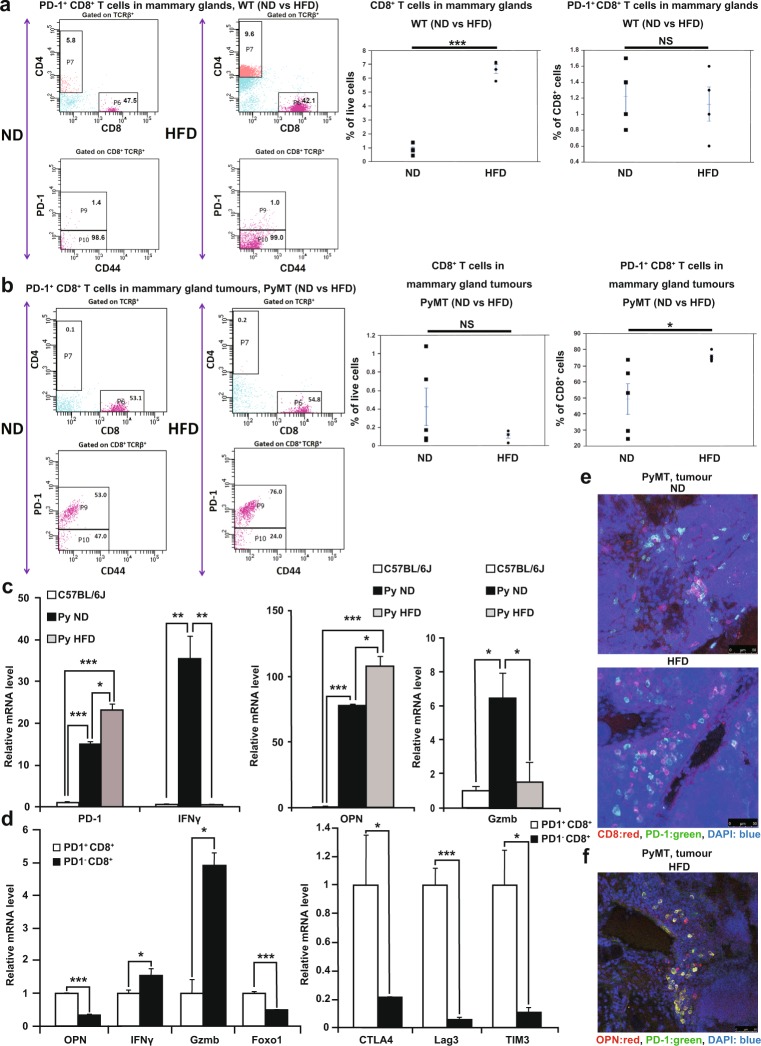
Figure 3.
High-fat diet promotes the accumulation of PD-1+ CD8+ exhausted T cells. (a) Flow cytometric analysis of PD-1+ CD8+ T cells in mammary glands harvested from ND-fed WT mice and HFD-fed WT mice at 20 weeks of age (n = 4 per group). (b) Flow cytometric analysis of PD-1+ CD8+ T cells in tumours harvested from ND-fed PyMT mice and HFD-fed PyMT mice at 20 weeks of age (n = 5 per group). (c) Quantitative RT-PCR analysis of PD-1, Ifng, Opn and Gzmb mRNA expression in CD8+ T cells from the mammary glands of WT mice and from the tumour tissue of ND-fed PyMT mice and HFD-fed PyMT mice (n = 3 per group). (d) Quantitative RT-PCR analysis of Opn, Ifng, Gzmb, Foxo1, CTLA4, LAG3 and TIM3 mRNA expression in PD-1+ CD8+ T cells and PD1- CD8+ T cells from the tumour tissue of HFD-fed PyMT mice (n = 3 per group). (e) Representative PD-1 (green) and CD8 (red) immunostaining with DAPI (blue) staining of tumours from ND-fed PyMT mice and HFD-fed PyMT mice. (f) Representative PD-1 (green) and OPN (red) immunostaining with DAPI (blue) staining of tumours from HFD-fed PyMT mice. Error bars indicate the s.e.m. *P < 0.05, **P < 0.01 and ***P < 0.001; NS, not significant.

