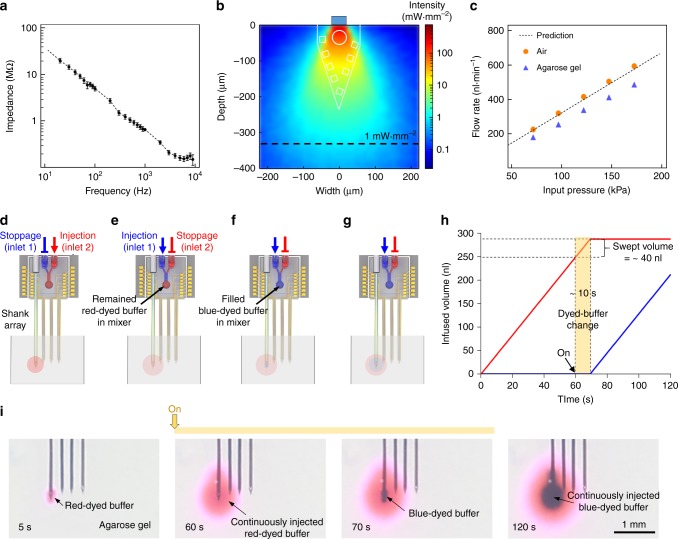
Fig. 2.
Characterization of the multifunctional multi-shank MEMS neural probe: a Impedance plot of 32 the Iridium microelectrodes. Error bars indicate s.d.; b Simulated light intensity map in brain tissue using Monte Carlo simulation based on measured output power (blue light, 454 μW at the end of the SU-8 waveguide); c Plot of flow rates with different input pressures; d–g Schematic diagram of multi-dyed buffer injection: d Loaded red-dyed buffer injection in inlet 2; e A stoppage of red-dyed buffer injection to the agarose gel and loaded blue-dyed buffer injection in inlet 1; f Blue-dyed buffer injection into the agarose gel after flushing out the filled red-dyed buffer dye in the microfluidic mixer; g Continuous infusion of the blue-dyed buffer into the agarose gel; h Plot of the infused volume of red- and blue-dyed buffers from the probe to 0.9% agarose gel; i Sequential photographs of multi-dyed buffer injection in 0.9% agarose gel when the flow rate was 0.3 μl⋅mim−1

