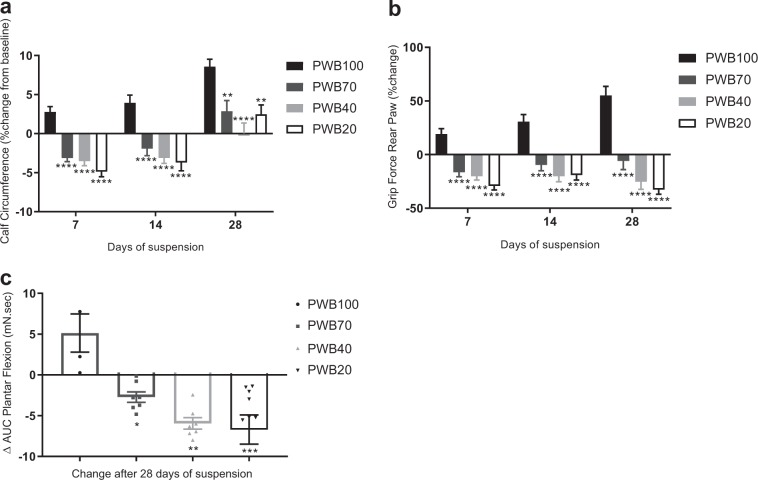
Fig. 2.
Longitudinal assessment of muscle function. Weekly change in calf circumference (a) and rear paw grip force (b) of all animals (n = 11–12 per group). 4-weeks change in the area under curve (AUC) obtained during the tetanic plantar flexion (c, n = 3–6 per group). Results are presented as mean ± SEM and Tukey’s post hoc tests following one-way ANOVA (c) or two-way ANOVA (a, b) are represented as *: p < 0.05, **: p < 0.01, ***: p < 0.001, and ****: p < 0.0001 vs PWB100

