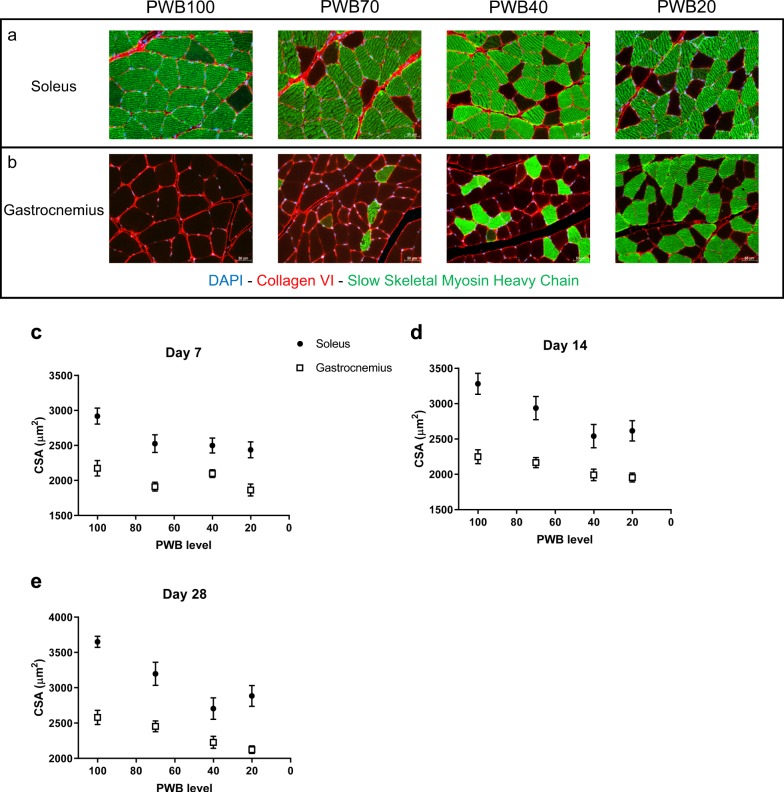
Fig. 4.
Histomorphometric analysis of the triceps surae. Immunofluorescence staining of the soleus (a) and the gastrocnemius (b) using antibodies targeting DAPI (blue), Collagen VI (red), and slow skeletal myosin heavy chain (green). Average cross-section area (CSA) of the soleus and gastrocnemius muscles after 7 days (c), 14 days (d), and 28 days (e) of PWB at all levels. Scale bars are indicated in the bottom right corner of each picture and represent 50 µm. Each muscle was analyzed across groups using a one-way ANOVA followed by a post hoc test for trend. Results are presented as mean ± SEM and post hoc tests for linear trend and R2 values of the fits are as follow. a Soleus p < 0.01, R2 = 0.79, Gastrocnemius p < 0.05, R2 = 0.39. b Soleus p < 0.01, R2 = 0.89, Gastrocnemius p < 0.01, R2 = 0.97. c Soleus p < 0.0001, R2 = 0.83, Gastrocnemius p < 0.0001, R2 = 0.99 (n = 11–12 per group)

