Fig. 4.
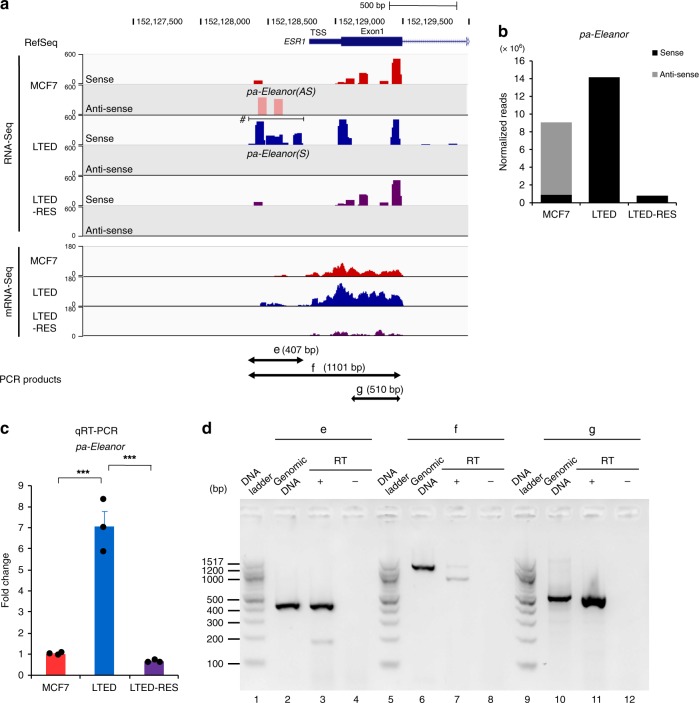
The ESR1 promoter is transcribed differentially in MCF7 and long-term estrogen deprivation (LTED) cells. a Alignment of RNA-Seq and mRNA-Seq of the human ESR1 promoter-proximal region in the indicated cells27. Peaks in RNA-Seq indicate transcripts with sense (dark colors) and antisense (pale colors) orientation relative to the ESR1 gene. In MCF7 cells, antisense transcription was detected at the transcription start site (TSS), which then switched to opposite direction to produce pa-Eleanor(S) (denoted by the horizontal bar with hash (#)) in LTED cells. Positions of the PCR products (e–g) in d are shown at the bottom. b Number of sequencing reads mapped at the TSS of the ESR1 gene. Numbers corresponding to sense and antisense RNA were counted and normalized according to the total number of mapped reads. c Expression levels of pa-Eleanor in the indicated cells determined with quantitative reverse transcription polymerase chain reaction (qRT-PCR). Values in MCF7 cells were set to 1. Data are representative of three independent experiments (mean ± s.e.m.). P values were calculated using unpaired, two-tailed, Student’s t test (***P < 0.001). d Local expression of pa-Eleanor(S) at site e in LTED cells. RT-PCR to amplify predicted transcripts as shown in a (e–g) resulted in successful detection of the e-fragment (pa-Eleanor, lane 3) and g-fragment (exon1 of ESR1, lane 11) by electrophoresis but not the f-fragment (lane 7). These results indicate that pa-Eleanor(S) is not contiguous with the ESR1 mRNA. All primers and amplification conditions were validated with PCR in parallel with genomic DNA as a template and RT-PCR with and without reverse transcription (RT+ and −)

