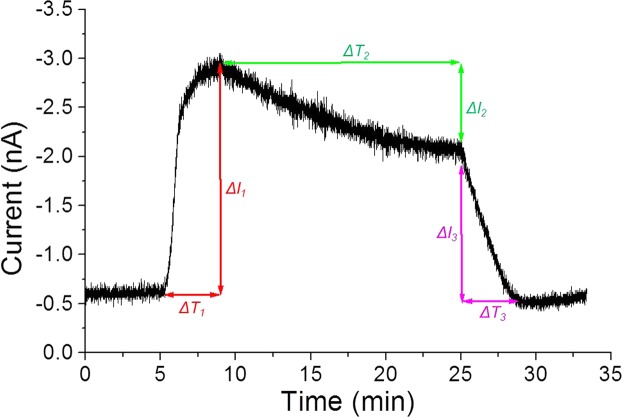
Figure 6.
Details showing parameters utilized for calculation of oxygen evolution. Changes in O2 reduction current of a single randomly selected electrode (indicated by a red open square in Fig. 3) measured with spinach leaves illuminated at 30 klx. V, ΔI and ΔT represents the concentration of evolved O2, change in O2 reduction current and time duration, respectively. The parameters were considered for calculations of oxygen evolution as presented in Table 1.

