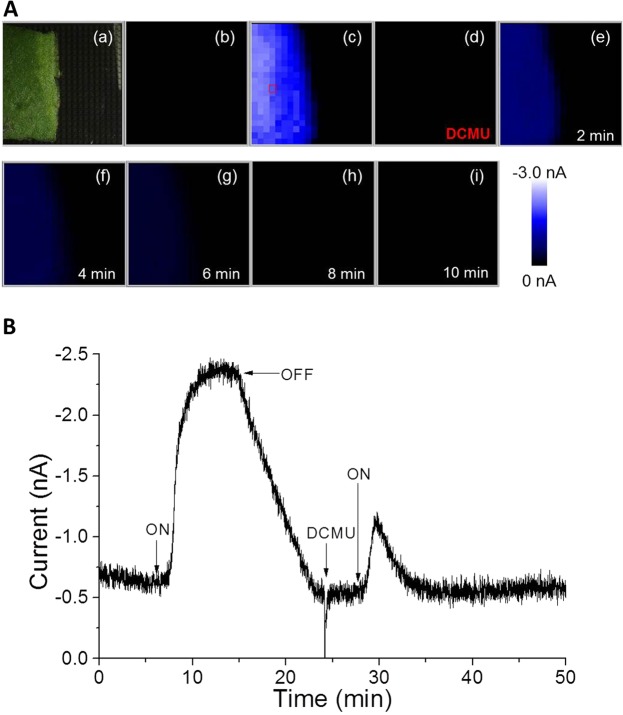
Figure 8.
(A) Photograph showing the arrangement of spinach leaf on the Bio-LSI chip (a), real-time imaging of O2 reduction current without (b) and with illumination at 30klx (c). The illumination was turned off 10 min after the start of illumination and DCMU (5 μM) was added 10 min after turning off the light. Then, the illumination was turned on again after the addition of DCMU and subsequent images were taken at 0 min (d), 2 min (e), 4 min (f), 6 min (g), 8 min (h), 10 min (i) after turning on the light (at 28 min). (B) The change in reduction current measured on a single randomly selected electrode (indicated by a red open square in Fig. 8C).

