Fig. 1.
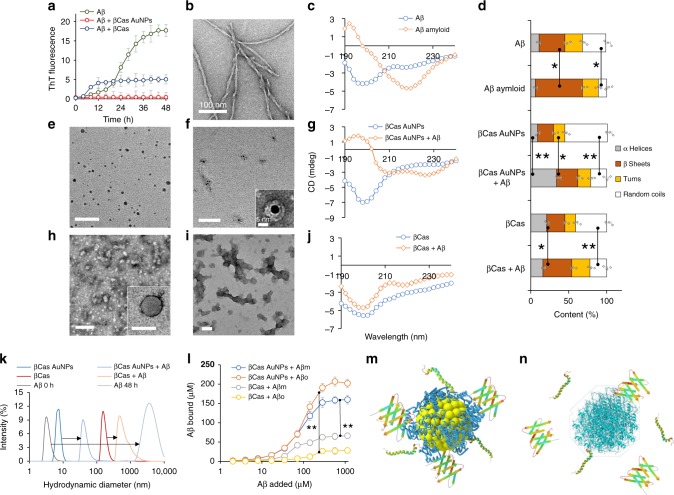
In vitro inhibitory interactions between βCas AuNPs and βCas with Aβ. a ThT assay of Aβ alone (50 µM) and in the presence of βCas AuNPs (equivalent to 6.25 µM of βCas) and βCas (6.25 µM) (n = 4). βCas AuNPs completely inhibited while βCas decreased (p < 0.005) the lag time and plateau ThT fluorescence of Aβ fibrillization. b TEM image of fibrillized Aβ. c CD spectra of Aβ (100 µM) before and after fibrillization indicate conformation change from random coils (198 nm peak) to β-sheets (220 nm peak). d Secondary structure of Aβ (100 µM) fibrillized with and without βCas AuNPs or βCas (n = 4). TEM images of βCas AuNPs before (e) and after incubation with Aβ (f; inset shows Aβ corona on a βCas AuNP). g CD spectra of βCas AuNPs before and after incubation with Aβ. TEM images of βCas before (h) and after (i) incubation with Aβ. j Appearance of a negative peak at 218 nm in CD spectra of βCas + Aβ indicates limited Aβ fibrillization into β-sheets. After binding with Aβ, the α-helix contents of βCas AuNPs were decreased significantly (p < 0.05) from 56 to 21%; while in the case of βCas, α-helices decreased from 41 to 22% (p < 0.005) and β-sheets increased from 24 to 38% (p < 0.05). k Hydrodynamic radius of Aβ before and after fibrillization in the presence and absence of βCas AuNPs or βCas. l Quantification of binding capacity of βCas AuNPs or βCas with Aβm or Aβo (n = 4). βCas AuNPs (6.25 µM βCas equivalent) were able to bind up to 152.3 ± 13.4 and 190.7 ± 10.9 µM of Aβm and Aβo. βCas (6.25 µM) was only able to adsorb 62.4 ± 3.4 and 26.4 ± 4.6 µM of Aβm and Aβo, indicating a significant (p < 0.005) increase in Aβ binding capacity of βCas in the form of βCas AuNPs. m, n Enhanced binding of Aβm and Aβo with βCas promoted by the AuNP substrate. Scale bars in TEM images is 100 nm, while F inset is 5 nm. Error bars represent the standard deviation. Source data are provided as a Source Data file

