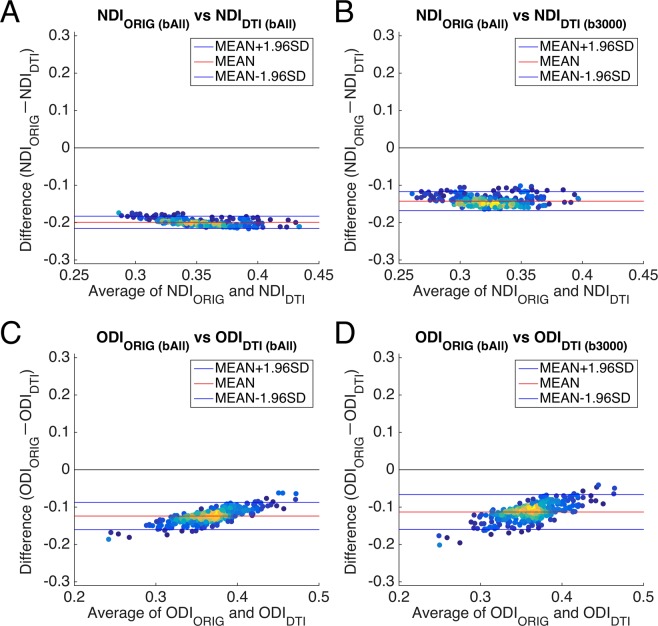
Figure 5.
Bland-Altman plots between DTI-derived NODDI and original NODDI parameters in vivo. (A,C) show Bland-Altman plots between DTI-derived NODDI parameters in the three -shell dataset (bAll) and the original NODDI parameters in the three-shell dataset (bAll). (B,D) Show Bland-Altman plots between DTI-derived NODDI parameters in the high b-value one-shell dataset (b3000) and the original NODDI parameters in the three-shell dataset (bAll). Plots are coloured by their density. Blue lines show the mean ± 1.96 * SD and the red line shows the mean value. Abbreviations; NDIORIG: neurite density index estimated using the original NODDI model, ODIORIG: orientation dispersion index estimated using the original NODDI model, NDIDTI: neurite density index estimated using DTI-derived NODDI, ODIDTI: orientation dispersion index estimated using DTI-derived NODDI.

