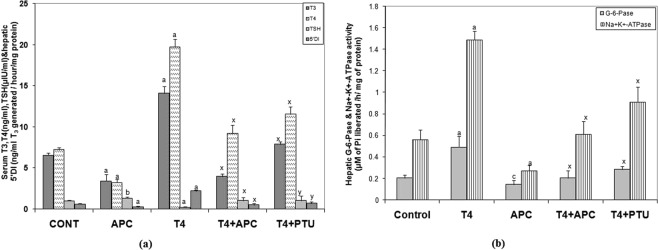
Figure 3.
(a) Changes in concentrations of serum T3 (ng/ml), T4 (ng/ml X10), TSH (µIU/ml) and hepatic 5′D1 (ng/ml T3 generated/hour/mg protein), following the administration APC (2.0 mg/kg/d) alone or T4 + APC or T4 + PTU. Each bar represents the mean ± SEM (n = 7). aP < 0.001 and bP < 0.01 as compared to the respective control value; whereas xP < 0.001 and yP < 0.01, as compared to the respective value of L-T4 treated group. (b) Changes in hepatic G-6-Pase (μM of Pi liberated/h/mg protein) and Na+-K+-ATPase activity (μM of Pi liberated/h/mg of protein) following the administration APC (2.0 mg/kg/d) alone or T4 + APC or T4 + PTU in rats. Each vertical bar represents the mean ± SEM. (n = 7). aP < 0.001 as compared to the respective control value, whereas xP < 0.001 as compared to the value of L-T4 treated animals.

