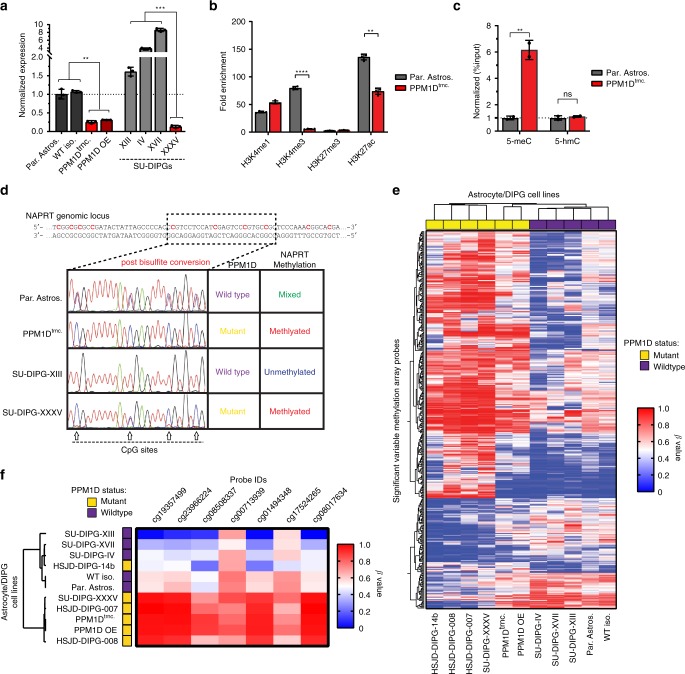
Fig. 3.
Epigenetic events silence NAPRT expression in PPM1D mutant glioma models. a Quantification of NAPRT transcript levels via qPCR, in wild type (gray) and mutant PPM1D-expressing (red) astrocytes and DIPG cell lines (n = 3 biological independent samples, **p < 0.01, ***p < 0.001 by Student’s T test). b Chromatin Immunoprecipitation (ChIP) of common histone 3 modifications at the NAPRT promoter; quantified as fold enrichment over IgG control (n = 4 biological independent samples, **p < 0.01, ****p < 0.0001 by Student’s T test). c Quantification of methylated DNA (5-meC), and hydroxymethylated DNA (5-hmC), immunoprecipitated from the NAPRT promoter (n = 2 biological independent samples, **p < 0.01 by Student’s T test). d Sequencing chromatograms of the NAPRT promoter within astrocytes and SU-DIPG cell lines after bisulfite conversion; arrows indicate potential CpG methylation sites. e Heatmap and clustering analysis of the 390 most significant variable Infinium Methylation EPIC array probes, across different astrocyte and DIPG models. f Heatmap and hierarchical clustering analysis of methylation array probes located within NAPRT CpG island promoter region. All error bars represent 95% confidence intervals about the mean

