Figure 6.

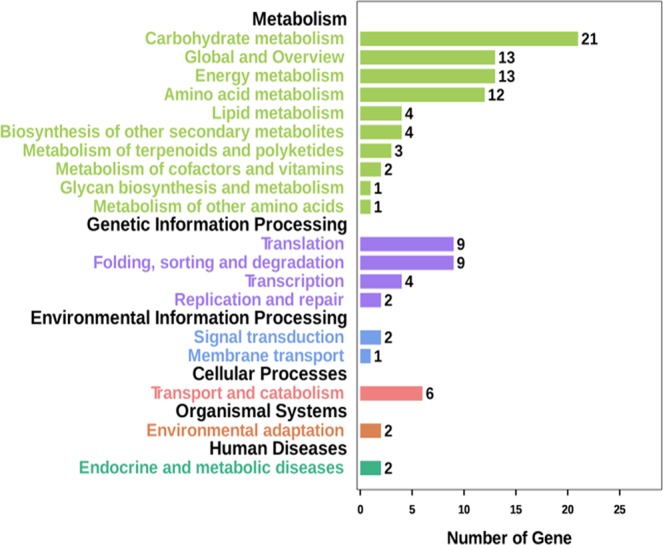
Pathway analysis of differentially expressed genes. X axis means number of DEGs. Y axis represents second KEGG pathway terms. All second pathway terms are grouped in top pathway terms indicated in different color.

Pathway analysis of differentially expressed genes. X axis means number of DEGs. Y axis represents second KEGG pathway terms. All second pathway terms are grouped in top pathway terms indicated in different color.