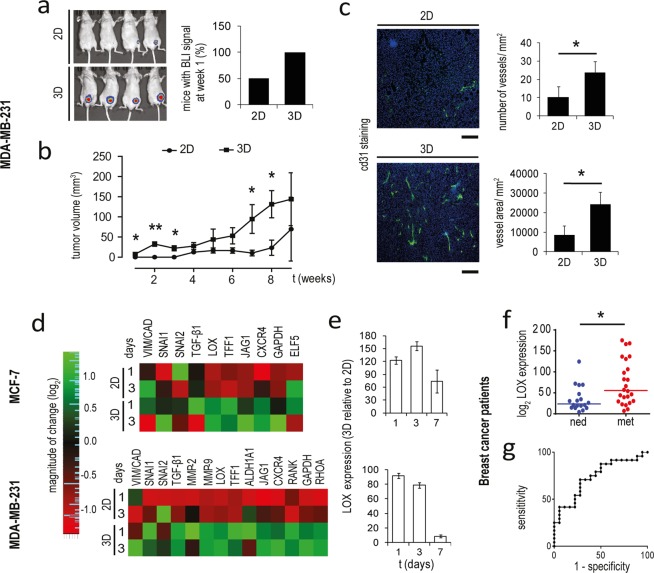
Figure 4.
Cells cultured in the scaffold exhibit aggressive features. (a) Whole body IVIS imaging and percentage of mice with detectable tumors after 1 week from the orthotopic injection of MDA-MB-231 cultured in monolayer (2D) or in the scaffold (3D). (b) Tumor volume of mice with orthotopic injection of 2D and 3D cultured MDA-MB-231. Data represent mean ± S.E.M (n = 5) *p < 0.05. (c) Representative images of Cd31 stained histological sections, number of vessel for mm2, and vessel area for mm2 in xenograft tumors generated by orthotopic injection of 2D and 3D cultured MDA-MB-231. Cd31 positive cells (green) and nuclei stained with DAPI (blue). Scale bars: 300 µm. Data represent mean ± S.D. (n = 3). (d) Heatmap visualization of relative expression values of biomarkers related to tumor aggressiveness in MCF-7 and MDA-MB-231 in monolayer culture or within the scaffold. (e) Relative expression levels of LOX in MCF-7 and MDA-MB-231 within the scaffold versus monolayer cultures on days 1, 3 and 7. (f) Relative expression levels of LOX in breast cancer patients. *p < 0.01, two-sample Wilcoxon rank-sum test. (g) ROC curve of LOX accuracy as prognostic factor in patients with breast cancer.

