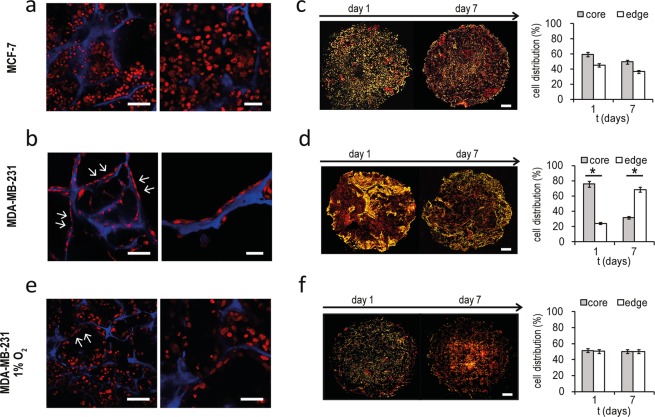
Figure 5.
MDA-MB-231 migrate at the scaffold edges over time. (a,b) Confocal microscopy images at different magnifications of MCF-7 and MDA-MB-231 within the scaffold on day 7. Cells are stained with DRAQ5 (red) and blue is the collagen scaffold autofluorescence. For the left panels, scale bars: 50 µm. For the right panels, scale bars: 20 µm. (c,d) Whole images of histological sections of scaffold cultured with MCF-7 and MDA-MB-231 on day 1 and 7, and percentages of cells in edge or core regions of the scaffold. Cells are stained with DAPI (yellow) and red is the collagen scaffold autofluorescence. Scale bars: 1 mm. Data represent mean ± S.E.M (n = 3). (e) Confocal microscopy images of MDA-MB-231 within the 3D scaffold on day 7 under hypoxic state (1% O2). Cells are stained with DRAQ5 (red) and blue is the collagen scaffold autofluorescence. For the left panel, scale bar: 50 µm. For the right panel, scale bar: 20 µm. (f) Whole images of histological sections of scaffold cultured with MDA-MB-231 on day 1 and 7 under hypoxic state, and percentages of cells in edge or core regions of the scaffold. Scale bars: 1 mm. Data represent mean ± S.E.M (n = 3). Cells are stained with DAPI (yellow) and red is the collagen scaffold autofluorescence.

