Figure 5.
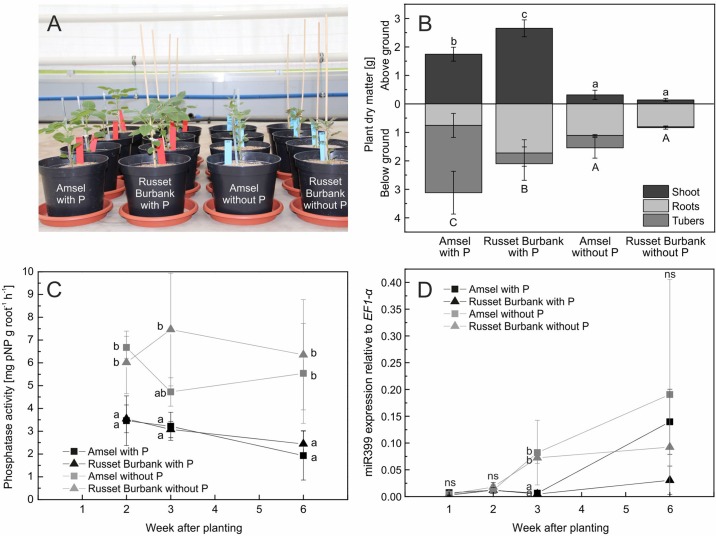
In vitro propagated potato genotypes grown in sand and fertigated with nutrient solutions with or without phosphate (A), means and standard deviations of plant dry matter after 6 weeks of growth (B), phosphatase activity on roots (C), and miR399 expression relative to EF1-α expression (D). Different letters indicate significant differences between genotype/treatment combinations (B) or treatments according to Tukey’s HSD [p < 0.05, n = four (A, B, C) or three (D) biological replicates].

