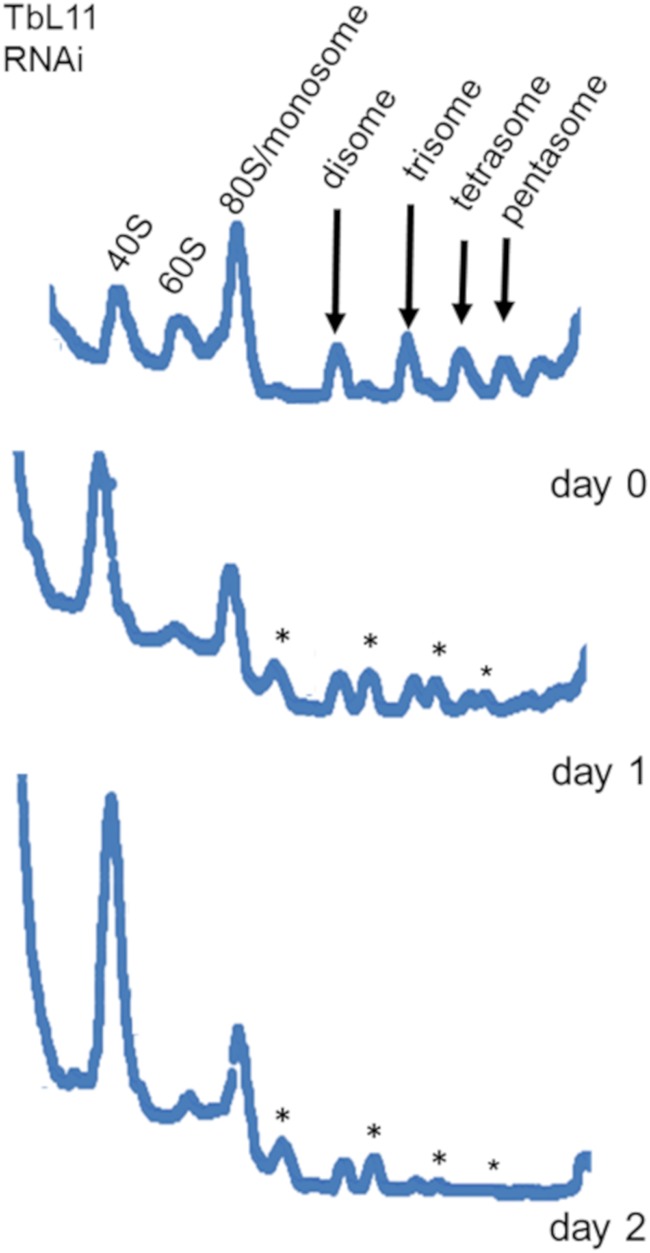
FIG 3.

Knockdown of TbL11 decreases 60S and 80S subunits and generates halfmer peaks. Cells were collected at days 0 to 2 after induction of RNA interference knockdown of TbL11, and polysome profile analyses were performed on extracts from these cells. Polysome peaks are indicated by arrows, and halfmer peaks are indicated by asterisks. Analyses were performed on three biological replicates, and representative tracings are shown.
